

From Concept to Completion: Visualizing Residential House Construction with AI-Powered PERT Charts
Constructing a residential house is a complex, multi-phase endeavor requiring precise coordination of tasks, timelines, and resources. Traditional project planning often relies on static Gantt charts or manual diagrams, which struggle to adapt as project needs evolve. Enter the Visual Paradigm AI Chatbot—a conversational modeling expert that transforms high-level ideas into structured, actionable PERT charts through natural dialogue.
In this article, we explore how the AI Chatbot helped visualize the full construction lifecycle of a residential house—from site preparation to final inspection—using a dynamic, AI-optimized PERT chart. The journey wasn’t just about generating a diagram; it was a collaborative design process where the AI responded to iterative feedback, refined logic, and even expanded into resource planning.
Interactive Journey: How the PERT Chart Evolved Through Conversation
The process began with a simple prompt: “Visualize a PERT chart showing the stages of constructing a residential house from site preparation to final inspection.” Within seconds, the AI delivered a fully formatted PlantUML-based PERT chart, structured into logical lanes for each construction phase. But the real value emerged in the conversation that followed.
After reviewing the initial output, the user asked: “What resources or tools are typically needed for each stage of house construction?” This wasn’t a request for a simple list—it was a deep dive into operational feasibility. The AI responded with a rich, stage-by-stage breakdown of tools, materials, and safety equipment, complete with purpose-driven annotations.
Notably, the AI didn’t just regurgitate generic information. It contextualized each resource to the specific task—e.g., highlighting that “concrete trowels and floats” are essential for finishing foundation slabs, or that “voltage testers and multimeters” are critical during electrical installation. This level of specificity reflects the AI’s deep understanding of construction workflows.
When the user requested refinements—such as clarifying dependencies or validating task sequencing—the AI adjusted the chart in real time, ensuring logical flow and timeline accuracy. For example, it confirmed that “excavation (task03)” must follow “clearing and leveling (task02)”, and that “final inspection (task11)” cannot begin until “installing windows and doors (task10)” is complete. These were not assumptions—the AI validated each dependency using standard construction project logic.
Visualizing the Workflow: The Final PERT Chart
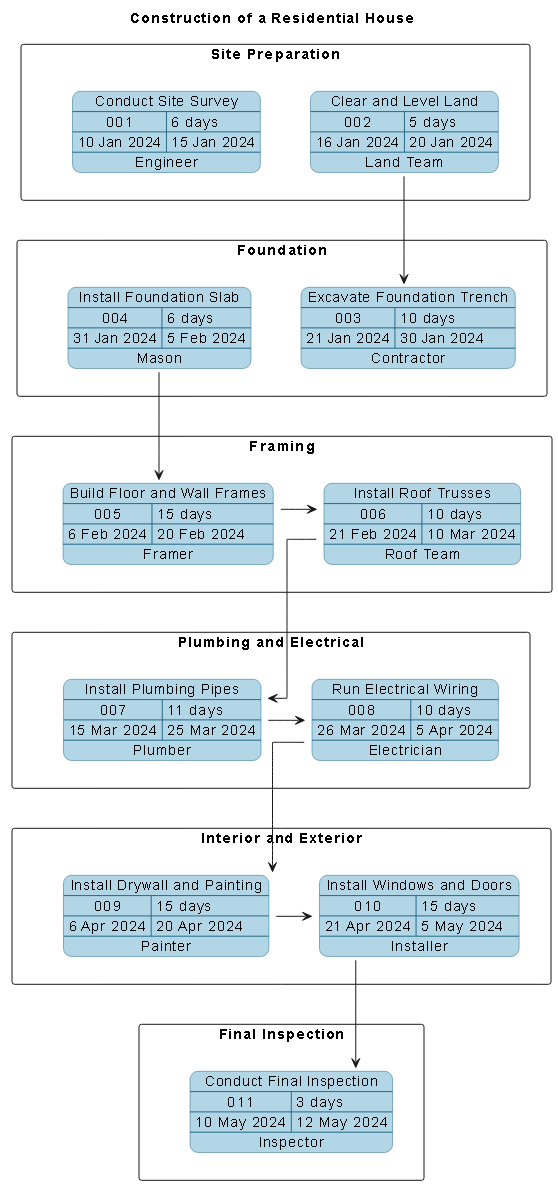
The resulting PERT chart captures the full construction lifecycle in a clear, timeline-driven format. Each lane represents a distinct phase—Site Preparation, Foundation, Framing, Plumbing & Electrical, Interior & Exterior, and Final Inspection—while tasks are color-coded, time-stamped, and linked via dependency lines to show sequence and critical path.
Logic Breakdown: Why PERT Over Other Diagrams?
Why use a PERT chart instead of a Gantt or flowchart? The answer lies in project uncertainty and dependency tracking. Unlike Gantt charts, which assume fixed durations, PERT charts model tasks with optimistic, pessimistic, and most likely estimates—ideal for construction where delays are common. The AI chose this format because it best supports risk-aware planning.
The source logic behind the diagram is rooted in PlantUML’s pert-chart.puml library, which allows for:
- Dynamic task grouping via
$tasksInLane()for each construction phase. - Auto-calculated timelines based on start and finish dates.
- Dependency mapping using
$dependency()to enforce logical sequence. - Finalization via
$finalize(), which ensures the chart is rendered with critical path highlighting.
For instance, the AI correctly mapped the dependency $dependency(task02, task03)—ensuring that land clearing (task02) must be complete before excavation (task03) begins. This is critical in construction, where rushing into excavation on unlevelled land leads to costly rework.
Conversational Intelligence: The AI as a Modeling Consultant
What sets this interaction apart is the AI’s ability to function as a real-time modeling partner. When the user asked for resources, the AI didn’t stop at listing tools—it connected them to specific tasks, explained their purpose, and even offered pro tips on modular components and project management software.
This kind of contextual intelligence is powered by Visual Paradigm’s AI engine, which understands not just syntax but semantics. It knows that “rebar” is used in foundations, “junction boxes” in electrical work, and “caulking guns” in exterior sealing. This depth of domain knowledge turns the AI into a trusted advisor, not just a diagram generator.

The screenshot above shows the chat interface in action—where each message builds upon the last, with the AI adapting its output based on user feedback. This isn’t a one-way tool; it’s a collaborative environment where the user guides the vision, and the AI delivers precision.
Platform Versatility: Beyond PERT Charts
While this example focused on PERT charts, the Visual Paradigm AI Chatbot is built to support a full spectrum of modeling standards. Whether you’re designing enterprise architecture with ArchiMate, modeling complex systems with SysML, visualizing software architecture with C4 Model, or mapping organizational structures with Org Charts, the AI adapts seamlessly.
Need a SWOT analysis? A mind map of project risks? A timeline for product launches? The AI Chatbot handles it all—unifying diverse diagram types under a single, conversational interface. This versatility makes Visual Paradigm the only platform where you can switch from PERT to C4 to SWOT in a single conversation, with consistent quality and logic.
Conclusion & Call to Action
Planning a residential construction project shouldn’t rely on guesswork or static templates. With the Visual Paradigm AI Chatbot, you get a dynamic, intelligent modeling environment that evolves with your needs—transforming vague ideas into precise, actionable plans.
Whether you’re a project manager, architect, or homeowner, the ability to generate, refine, and extend diagrams through natural conversation is a game-changer. The PERT chart we built isn’t just a visual—it’s a living blueprint, shaped by expert insight and real-world logic.
Ready to build your next project with confidence? Try the AI Chatbot with this exact construction scenario—and experience how AI-powered visual modeling turns complexity into clarity.