

Mapping the Timeline of Global Academic Excellence: An AI-Driven PERT Chart for Conference Planning
Organizing a large international academic conference is a complex orchestration of timelines, dependencies, and stakeholder coordination. With hundreds of tasks spanning theme selection, paper reviews, logistics, and post-event follow-ups, even minor delays can ripple across the entire project. The challenge isn’t just managing tasks—it’s identifying which ones are truly critical to on-time delivery.
Enter the Visual Paradigm AI Chatbot—not just a diagram generator, but a conversational modeling expert. By transforming natural language into structured, actionable PERT charts, it empowers planners to visualize workflows with precision and intelligence. In this article, we walk through how a user leveraged the AI Chatbot to create a comprehensive PERT chart for a global academic conference, then deepened their understanding through real-time dialogue.
From Prompt to Precision: A Collaborative Design Journey
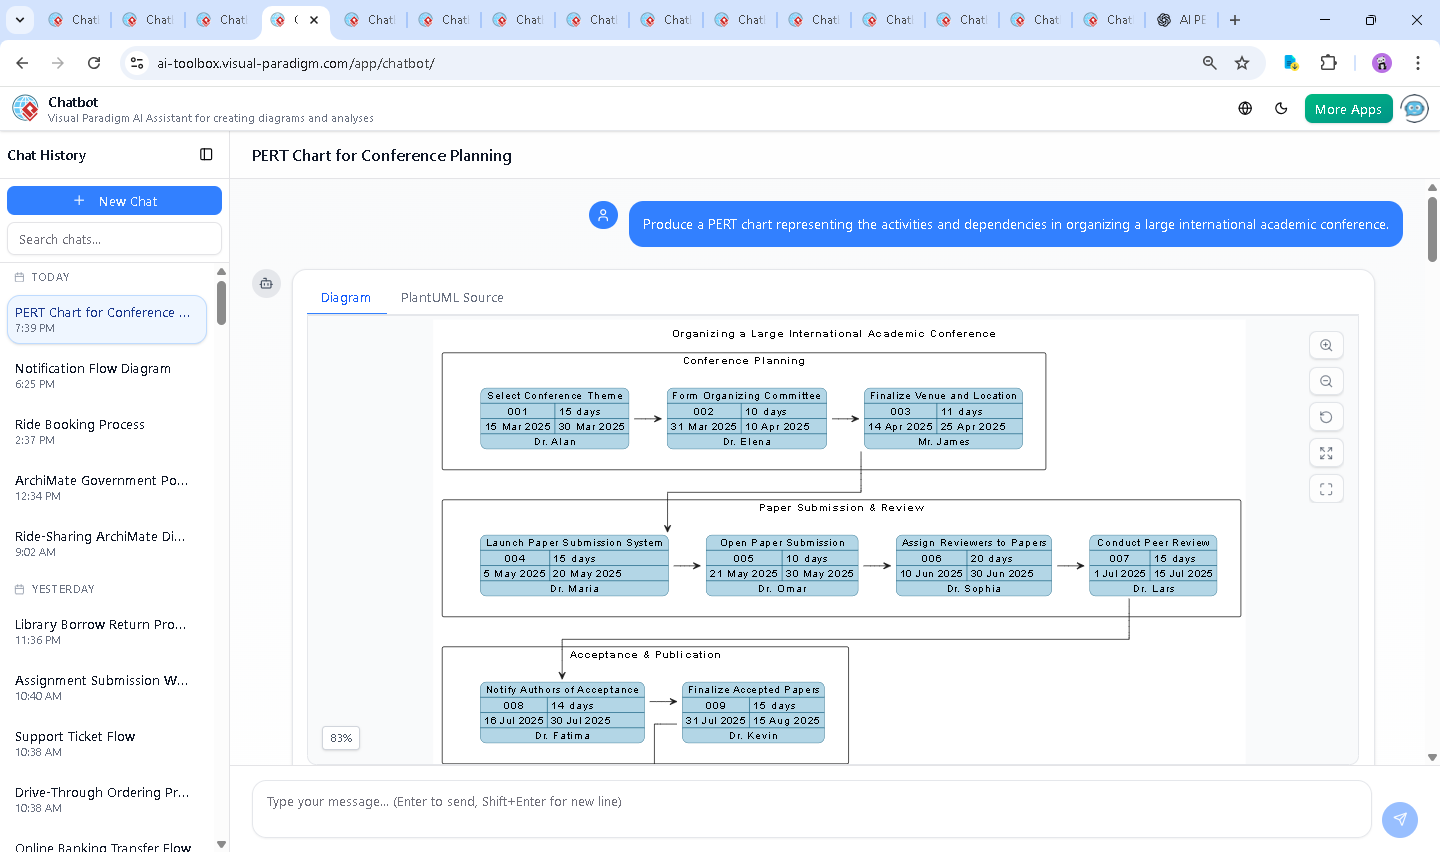
The journey began with a simple request: “Produce a PERT chart representing the activities and dependencies in organizing a large international academic conference.” Within seconds, the Visual Paradigm AI Chatbot delivered a fully structured PlantUML-based PERT chart, automatically organizing tasks into logical lanes and establishing dependencies.
But the real value emerged in the conversation that followed. When the user asked, “How can we identify critical path activities in this PERT chart to ensure timely completion?”, the AI didn’t just define the term—it provided a step-by-step analytical framework:
- Explained how the critical path is the longest sequence of dependent tasks.
- Walked through the method of calculating total duration across all paths.
- Highlighted that tasks with zero total float are on the critical path.
- Identified the likely critical path based on the timeline—especially those involving peer review, paper finalization, and logistics.
When the user requested further clarity, the AI responded with actionable insights: “Would you like me to generate a critical path summary in a table?” or “Create a Gantt-style timeline with critical path emphasized?” This isn’t automated output—it’s intelligent, adaptive collaboration.
Decoding the PERT Chart Logic: Structure, Timing, and Strategy
The generated PERT chart is more than a visual timeline—it’s a strategic blueprint. Here’s how the logic was built:
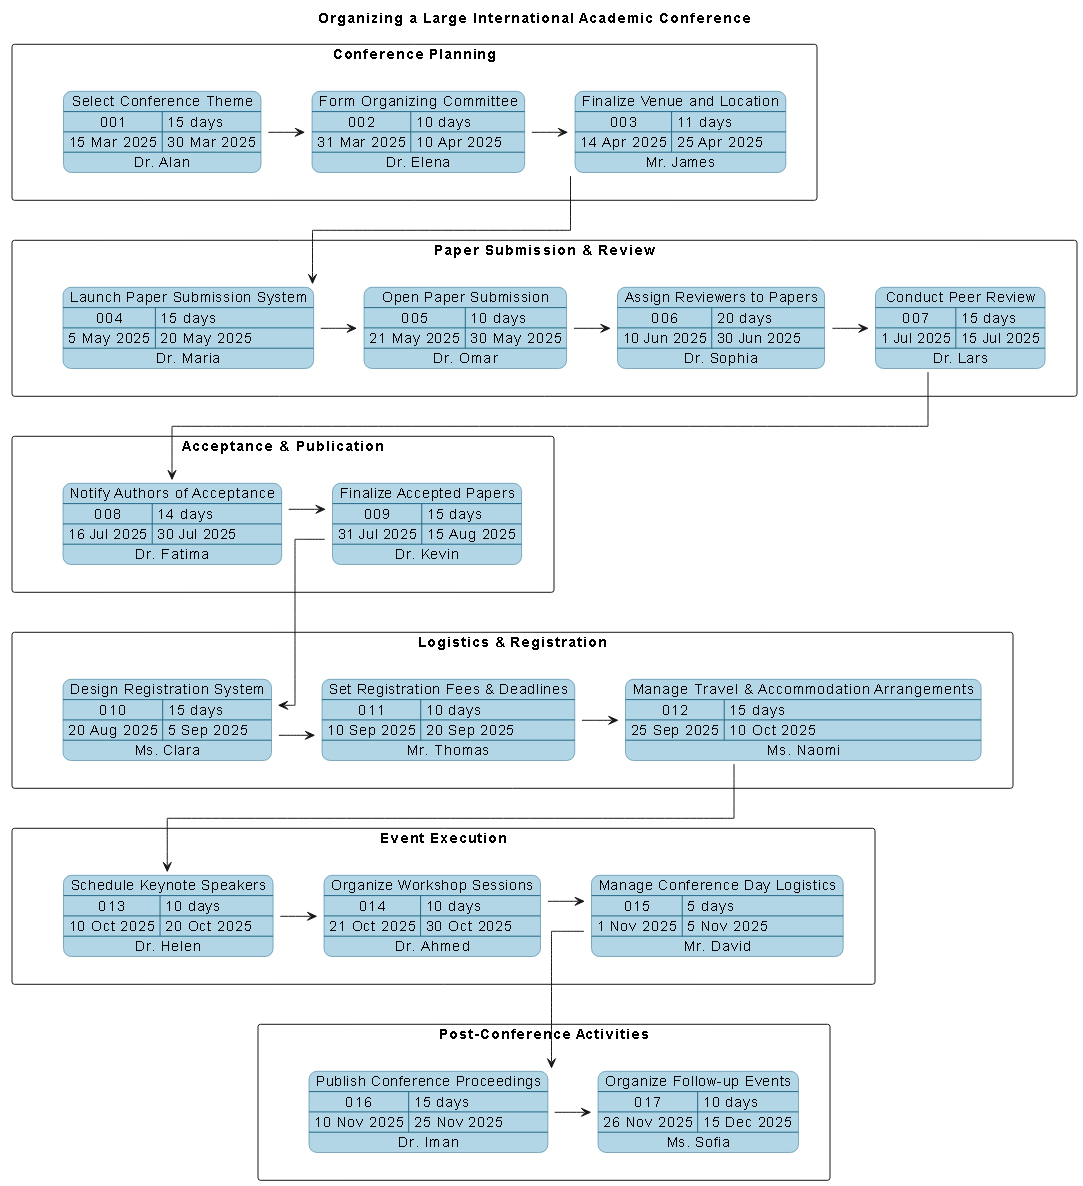
- Task Lanes: Tasks are grouped by function—Conference Planning, Paper Submission & Review, Acceptance & Publication, Logistics & Registration, Event Execution, and Post-Conference Activities. This structure mirrors real-world project phases, improving readability and accountability.
- Dependency Chain: The chart uses
$dependency(taskX, taskY)to define sequential relationships. For example,Finalize Venuemust complete beforeLaunch Paper Submissioncan begin—ensuring no task starts prematurely. - Time Tracking: Each task includes a start date, finish date, duration, and responsible person. This enables precise scheduling and resource allocation.
- Duration Logic: The chart uses realistic durations—e.g., 15 days for paper submission, 20 days for reviewer assignment—reflecting the time needed for academic peer review and administrative coordination.
By default, the AI chose a linear dependency model, but it’s fully adaptable. If the user later says, “Make paper submission and venue booking parallel tasks,” the AI would instantly restructure the chart to reflect that change.
Conversational Intelligence in Action: The AI as Your Modeling Partner
What sets Visual Paradigm apart isn’t just the output—it’s the dialogue. The AI doesn’t just answer questions; it anticipates them. When the user asked for critical path identification, the AI didn’t stop at theory. It:
- Provided a clear definition of the critical path.
- Offered a method to calculate it manually.
- Identified which tasks are most likely to be critical based on duration and dependency.
- Proposed next steps: table summaries, color-coded charts, or Gantt-style timelines.
This level of contextual understanding transforms the AI from a tool into a co-designer. The conversation shows that the AI isn’t just generating diagrams—it’s interpreting intent, clarifying assumptions, and guiding decision-making.
Beyond PERT: A Full-Spectrum Modeling Platform
While this example focused on PERT charts, the Visual Paradigm AI Chatbot is built to support a full suite of modeling standards. Whether you’re designing enterprise architectures with ArchiMate, modeling complex systems with SysML, visualizing software architecture with C4 Model, or brainstorming with Mind Maps, SWOT, PEST, Org Charts, or various data charts, the AI adapts to your needs.
For instance, if the user later says, “Show me how the organizing committee’s structure fits into the overall architecture,” the AI can switch to ArchiMate and generate an organizational model. Or if they request, “Visualize the risk exposure across conference phases,” the AI can produce a SWOT or PEST analysis—always maintaining consistency across diagrams.
Conclusion: Your Project, Guided by AI Intelligence
Organizing a global academic conference is a high-stakes, high-complexity endeavor. The Visual Paradigm AI Chatbot doesn’t just create diagrams—it enables smarter planning through conversational modeling. By turning natural language into precise, dependency-rich PERT charts, and then guiding users through analysis, prioritization, and refinement, it turns project planning into a dynamic, collaborative process.
Whether you’re a conference organizer, IT architect, or project manager, the platform offers the intelligence and flexibility to model any project—accurately, efficiently, and with confidence.