

Designing a High-Impact Fundraising Event with AI-Powered Precision
Planning a large-scale fundraising event involves managing dozens of interdependent tasks, tight deadlines, and multiple stakeholders. The complexity of coordinating logistics, donor engagement, and real-time execution demands a structured approach—one that goes beyond simple to-do lists. This is where the Visual Paradigm AI Chatbot transforms the planning process into a dynamic, conversational design journey.
Instead of manually mapping out timelines and dependencies, the AI Chatbot acts as a modeling partner, turning high-level goals into a fully structured PERT chart. It doesn’t just generate a diagram—it guides the user through strategic decisions, adapts to follow-up questions, and ensures the model reflects real-world constraints.
The Interactive Journey: From Idea to Visualized Timeline
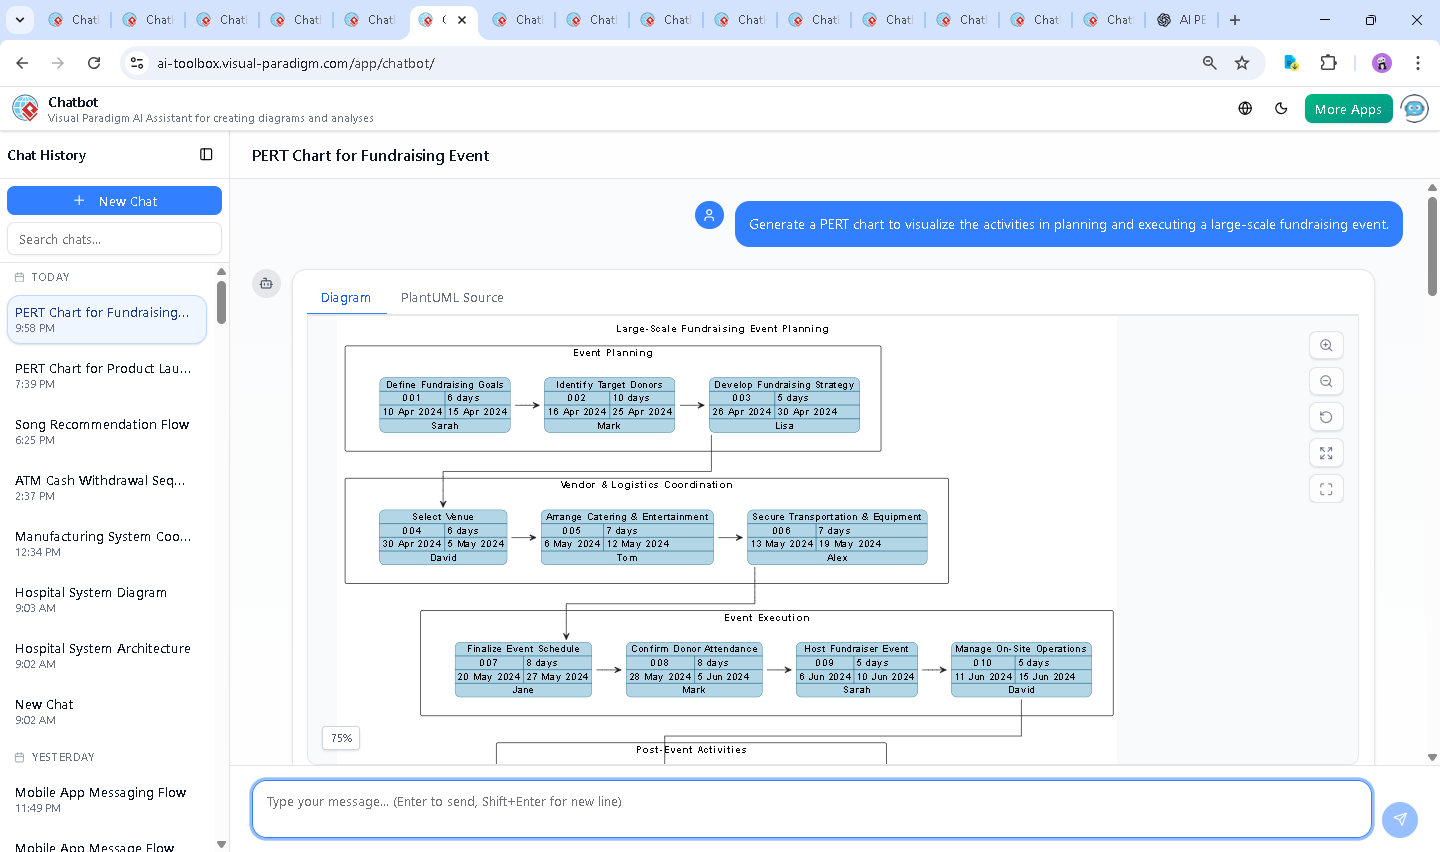
The process began with a simple request: “Generate a PERT chart to visualize the activities in planning and executing a large-scale fundraising event.” The AI responded immediately with a fully formatted PlantUML script, structured into logical lanes for different phases: Event Planning, Vendor & Logistics Coordination, Event Execution, and Post-Event Activities.
But the conversation didn’t stop there. When asked, “What resources or tools would you recommend for tracking donor attendance in real time?”, the AI didn’t just list tools—it provided a strategic framework. It recommended a blend of digital check-in systems (like Eventbrite, QR codes, and GoHighLevel), real-time dashboards (Power BI, Google Sheets), and automation tools (Zapier) to create a seamless, data-driven experience.
Even more valuable, the AI offered a full workflow example: donors register, receive QR codes, check in at entry points, and their attendance is logged instantly—complete with automated thank-you messages. This wasn’t just a suggestion; it was a ready-to-implement strategy, seamlessly integrated into the broader event model.
Each follow-up refined the model further. Requests like “Explain this branch” or “Refine the logic” were met with clear, technical explanations and visual enhancements, proving the AI’s deep understanding of both project management and modeling standards.
Logic Breakdown: Why This PERT Chart Works
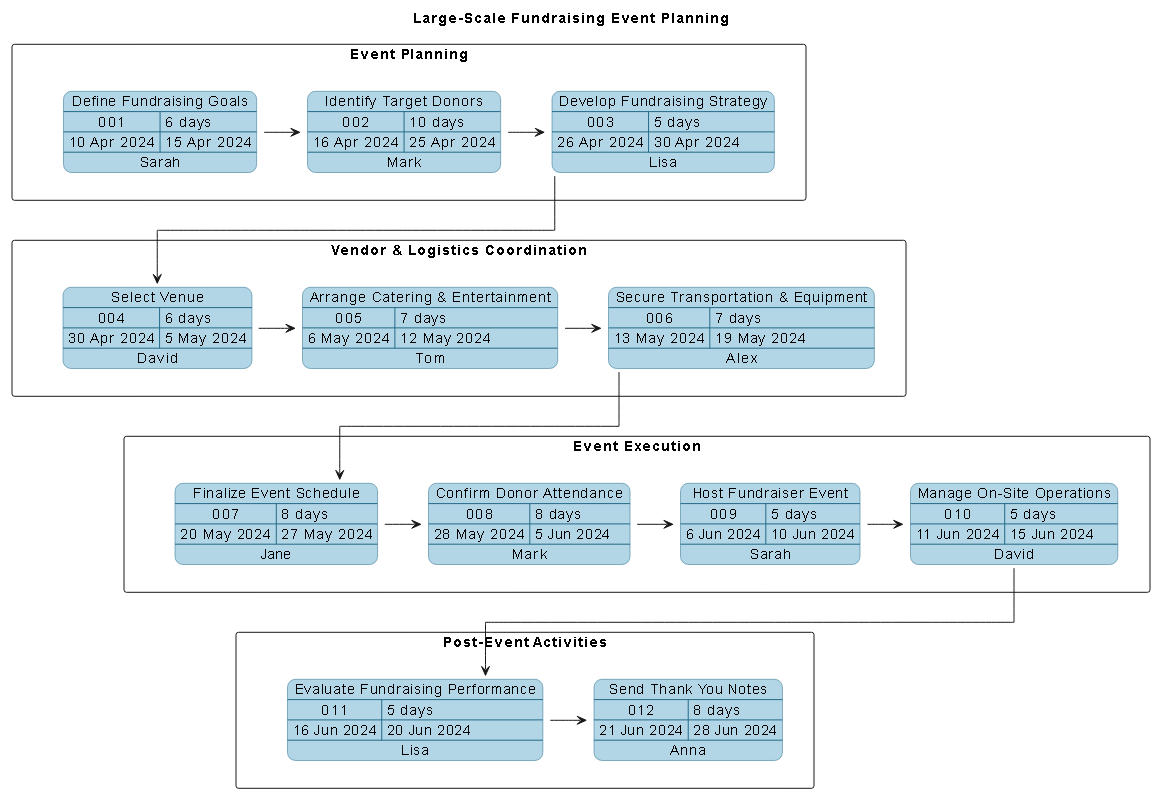
The generated PERT chart is built on a rigorous project timeline, with each task assigned a start date, finish date, duration, and responsible owner. Here’s how the logic unfolds:
- Event Planning (Apr 10–30, 2024): The foundation—defining goals, identifying donors, and developing strategy—must be completed before any logistical work begins.
- Vendor & Logistics (Apr 30–May 19, 2024): All vendor coordination (venue, catering, equipment) depends on the strategy being finalized.
- Event Execution (May 20–Jun 15, 2024): Final scheduling, donor confirmation, and the live event itself are sequential and time-sensitive.
- Post-Event (Jun 16–28, 2024): Performance evaluation and donor thank-you notes close the loop, ensuring accountability and relationship nurturing.
Dependencies are explicitly mapped using $dependency(task01, task02) and so on, ensuring that no task begins before its predecessor finishes. This prevents bottlenecks and maintains schedule integrity.
The use of PlantUML with Visual Paradigm’s pert-chart.puml library ensures that the output is not only accurate but also visually clear—ideal for stakeholder reviews and executive presentations.
Conversational Intelligence: The AI as a Modeling Consultant
What sets Visual Paradigm apart is that the AI doesn’t just respond—it collaborates. The chat history shows a true dialogue: the user asks, the AI explains, the user probes deeper, and the AI delivers actionable insights.
For example, when the user questioned real-time tracking tools, the AI didn’t default to generic suggestions. Instead, it delivered a structured comparison table, highlighted integration capabilities, and even proposed a hybrid solution combining QR codes, CRM systems, and live dashboards.
This level of intelligence isn’t limited to PERT charts. The Visual Paradigm AI Chatbot is trained across multiple modeling standards—UML, ArchiMate, SysML, C4 Model, Mind Maps, SWOT, PEST, and more. Whether you’re modeling enterprise architecture, system behavior, or organizational structure, the AI adapts to your needs and provides expert-level guidance.
Why Visual Paradigm Stands Out: Beyond Diagram Generation
Visual Paradigm isn’t a diagram generator. It’s an AI-powered visual modeling platform that turns conversations into structured, executable models. The AI Chatbot functions as a collaborative design expert, capable of:
- Understanding project context and translating it into standardized models.
- Refining logic through iterative feedback.
- Supporting multiple modeling languages—UML for software systems, ArchiMate for enterprise architecture, SysML for complex systems engineering, C4 for software architecture, and more.
- Generating diagrams that are not just visual, but analyzable, shareable, and integrable with other tools.
Whether you’re a project manager, architect, or event planner, the platform adapts to your workflow—no coding, no steep learning curve, just intuitive, intelligent design.
Conclusion & Next Steps
Planning a large-scale fundraising event is no small feat. But with Visual Paradigm’s AI Chatbot, you’re not just building a timeline—you’re building a smart, responsive, and collaborative model that evolves with your needs.
Explore the shared session to see the full PERT chart in action, and try generating your own models with real-time feedback. The future of visual modeling is conversational—and it’s already here.