

From Idea to Launch: A Collaborative Journey with AI-Powered PERT Chart Modeling
Developing an online learning platform is a complex, multi-phase endeavor that demands precision in planning, task sequencing, and timeline management. Traditional project planning tools often fall short when it comes to visualizing dependencies and dynamic workflows. That’s where the Visual Paradigm AI Chatbot steps in—not as a passive diagram generator, but as a collaborative modeling expert that transforms abstract ideas into structured, actionable project blueprints.
In this article, we walk through the real-time evolution of a PERT chart for an online learning platform, built entirely through conversational AI. The journey begins with a simple prompt: “Draw a PERT chart illustrating the stages of developing an online learning platform from ideation to launch.” What follows is a dynamic exchange between user and AI, where each follow-up request refines the model, deepens insight, and demonstrates the intelligence behind Visual Paradigm’s AI-powered visual modeling platform.
Interactive Journey: How the PERT Chart Evolved Through Conversation
The initial request was straightforward, but the real value emerged in the conversation that followed. After generating the PERT chart using PlantUML syntax embedded within Visual Paradigm’s AI engine, the user asked: “Explain this diagram.”
The AI responded not just with a summary, but with a structured breakdown—organizing the project into five clear phases, identifying task dependencies, and explaining the rationale behind the sequence. This wasn’t a static output; it was a collaborative interpretation, inviting the user to engage further.
Subsequent queries like “Explain this branch” or “Refine the logic” triggered deeper analysis. The AI didn’t just restate the data—it contextualized it. For example, when asked to clarify the dependency chain, the AI highlighted how the completion of “Define Learning Objectives” (task03) was a prerequisite for “Design Course Structure” (task04), reinforcing the logical flow of product design.
These interactions showcase the AI Chatbot’s role as a modeling consultant: it doesn’t just produce diagrams—it educates, validates, and adapts to the user’s evolving understanding. This conversational intelligence is what sets Visual Paradigm apart from basic diagramming tools.
Logic Breakdown: The Structure Behind the PERT Chart
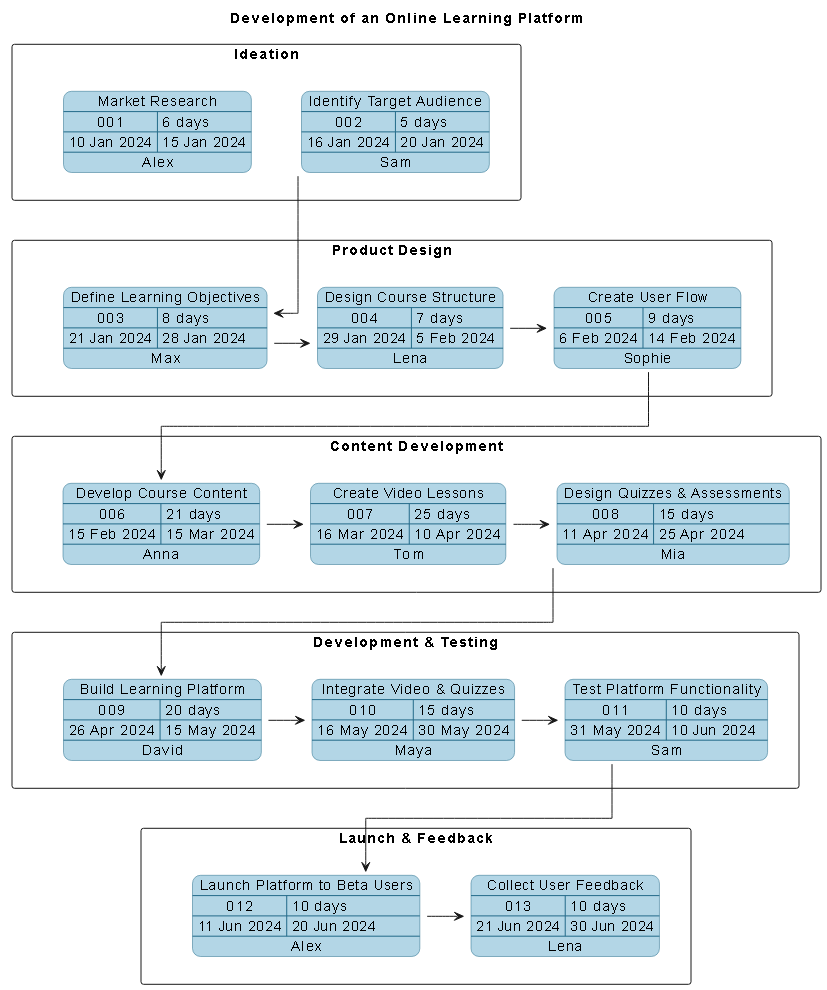
The PERT chart is more than a timeline—it’s a strategic blueprint. Let’s unpack the source logic and the reasoning behind each design decision:
Phase 1: Ideation (Jan 10 – Jan 20, 2024)
Market Research and Target Audience identification form the foundation. These tasks are sequenced to ensure that the platform is built around real user needs, not assumptions. The AI chose a linear dependency: “Identify Target Audience” must complete before “Define Learning Objectives” can begin.
Phase 2: Product Design (Jan 21 – Feb 14, 2024)
With audience defined, the team moves to structuring the platform. The tasks—defining objectives, designing course structure, and creating user flow—are logically linked. Each phase builds on the last, ensuring that the user experience is coherent and purposeful.
Phase 3: Content Development (Feb 15 – Apr 25, 2024)
Content creation follows the design. The AI enforced the dependency chain: user flow must be defined before content can be developed, and video production must follow content development. This reflects real-world constraints: you can’t film a lesson without a script.
Phase 4: Development & Testing (Apr 26 – Jun 10, 2024)
Building the platform is a high-stakes phase. The AI ensured that platform development couldn’t start until content was ready, and integration of videos and quizzes couldn’t happen until the platform was built. Testing comes last, confirming that all components work together before launch.
Phase 5: Launch & Feedback (Jun 11 – Jun 30, 2024)
Finally, the platform is released to beta users. The AI highlighted that feedback collection depends on launch, emphasizing the importance of post-launch iteration. This phase closes the loop, turning user insights into future improvements.
Notably, the AI chose a sequential workflow rather than a parallel one—ideal for clarity and risk control in early-stage projects. However, the chatbot was quick to suggest alternatives: “Let me know if you’d like a version with parallel tasks or a Gantt-style version.” This responsiveness underscores the platform’s adaptability.
Conversational Intelligence in Action
The true strength of the Visual Paradigm AI Chatbot lies in its ability to act as a co-designer. When the user requested an explanation, the AI didn’t just list tasks—it provided context, dependencies, and strategic insights. This is where the AI’s intelligence shines: it understands not just the syntax of PERT charts, but the intent behind them.
For instance, the AI explained that the critical path—the longest sequence of dependent tasks—determines the project’s total duration. In this case, it’s approximately 140 days. This insight helps project managers identify where delays would have the biggest impact.
Moreover, the AI proactively suggested enhancements: Gantt chart versions, risk assessments, and interactive formats. These aren’t just features—they’re intelligent extensions of the conversation, designed to support decision-making at every stage.
Beyond PERT: A Full-Spectrum Modeling Platform
While this example focused on a PERT chart, the Visual Paradigm AI Chatbot is not limited to one diagram type. It supports a full spectrum of modeling standards, including:
- UML – For software design, system behavior, and component modeling.
- ArchiMate – For enterprise architecture, aligning business, application, and technology layers.
- SysML – For systems engineering, capturing requirements, behavior, and structure.
- C4 Model – For software architecture visualization, from context to containers and components.
- Mind Maps, SWOT, PEST, Org Charts, and Charts (column, pie, line, area) – For strategic planning, analysis, and data visualization.
This versatility means that the same AI Chatbot can support a product manager, an enterprise architect, a developer, or a startup founder—regardless of their domain. Whether you’re designing a microservice architecture, mapping stakeholder relationships, or analyzing market trends, Visual Paradigm’s AI adapts to your needs.
Conclusion & Next Steps
The development of an online learning platform is a journey of complexity, risk, and opportunity. With Visual Paradigm’s AI Chatbot, that journey becomes collaborative, transparent, and guided by intelligent design.
From ideation to launch, the AI didn’t just generate a diagram—it helped you think through the project, validate dependencies, and anticipate bottlenecks. The result? A clear, actionable PERT chart crafted using the Visual Paradigm AI Chatbot, delivered through a conversational design environment that understands both your goals and your workflow.
Ready to bring your next project to life? Explore the live session and see how the AI Chatbot can transform your ideas into visual models—fast, smart, and fully collaborative.