

Mapping the Future: AI-Powered 5G Rollout with a Precision PERT Chart
Rolling out a nationwide 5G network is no small feat. It demands coordination across strategic planning, engineering, regulatory compliance, infrastructure deployment, and public engagement — all under tight timelines and budget constraints. The complexity of such a project calls for more than just a checklist; it demands a visual, dynamic model that captures dependencies, timelines, and critical paths in real time.
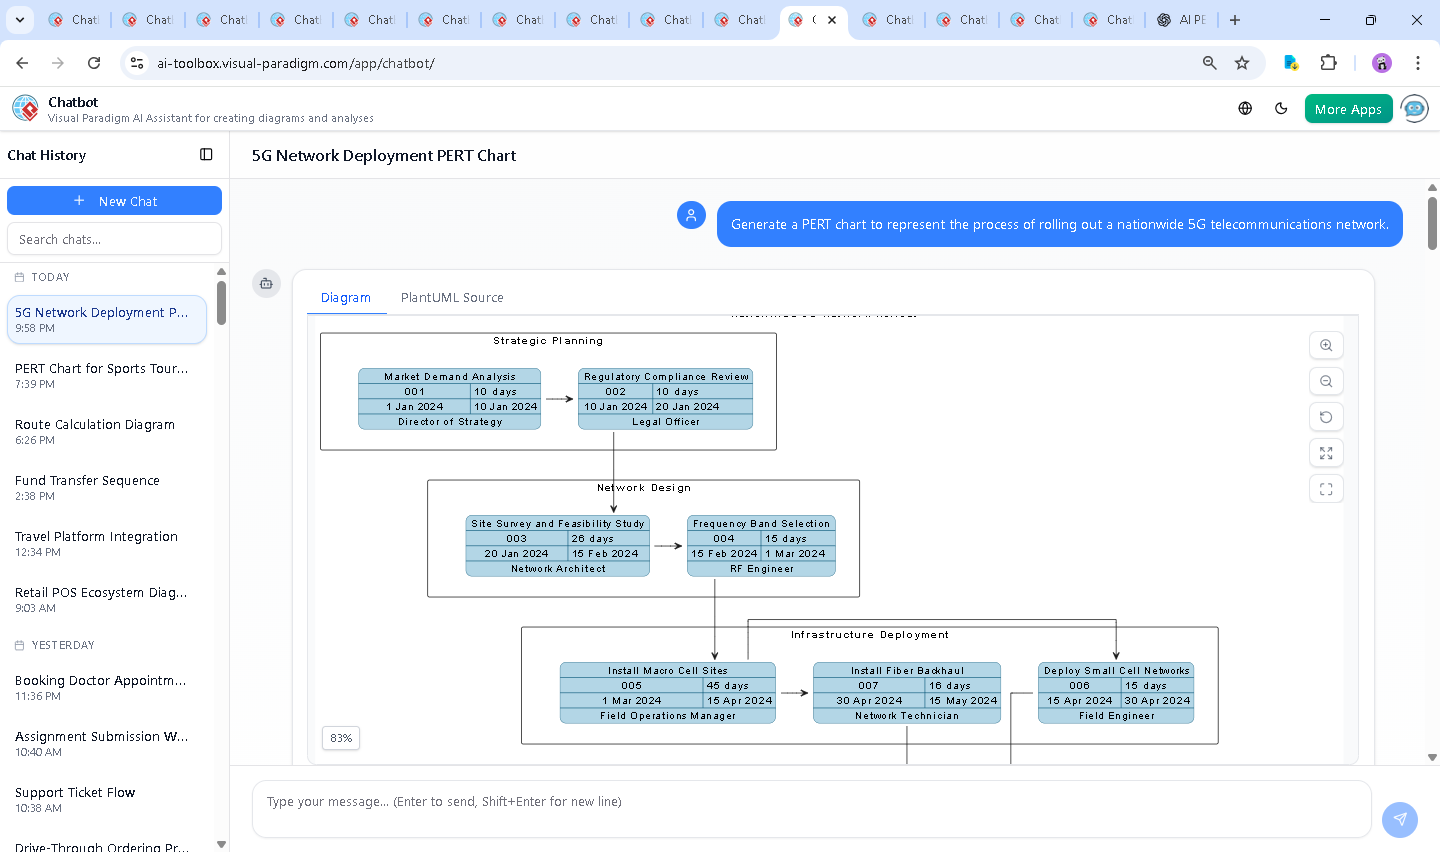
Enter the Visual Paradigm AI Chatbot — not just a diagram generator, but a collaborative modeling expert. When prompted to create a PERT chart for a national 5G rollout, the AI didn’t just render a static image. It engaged in a conversational design process, turning abstract project goals into a structured, executable plan.
From Prompt to Precision: A Collaborative Design Journey
The journey began with a simple request: “Generate a PERT chart to represent the process of rolling out a nationwide 5G telecommunications network.” The AI responded instantly with a fully rendered PlantUML-based PERT chart, structured by phases and enriched with real-world task details, durations, responsible roles, and inter-task dependencies.
But the conversation didn’t stop there. The user asked, “Explain this diagram.” Rather than offering a generic summary, the AI delivered a comprehensive breakdown — not just listing tasks, but explaining the why behind each dependency, the significance of the critical path, and the implications of task durations.
For example, when the user inquired about the sequence between macro cell installation and fiber backhaul, the AI clarified that both are parallel but dependent on the same predecessor — the macro site deployment. This level of contextual insight transforms the chatbot from a tool into a modeling consultant.
Further refinements followed: the user requested clarification on task logic, and the AI responded with a structured explanation of the critical path — totaling 166 days — highlighting that delays in early phases (like market analysis or site survey) would ripple through the entire project.
Each exchange demonstrated the AI’s ability to understand context, anticipate follow-up questions, and deliver expert-level insights — a hallmark of Visual Paradigm’s AI-powered visual modeling platform.
Decoding the PERT Chart: Logic Behind the Structure
The generated PERT chart is more than a timeline — it’s a strategic blueprint. Let’s walk through its core logic:
1. Phased Task Organization
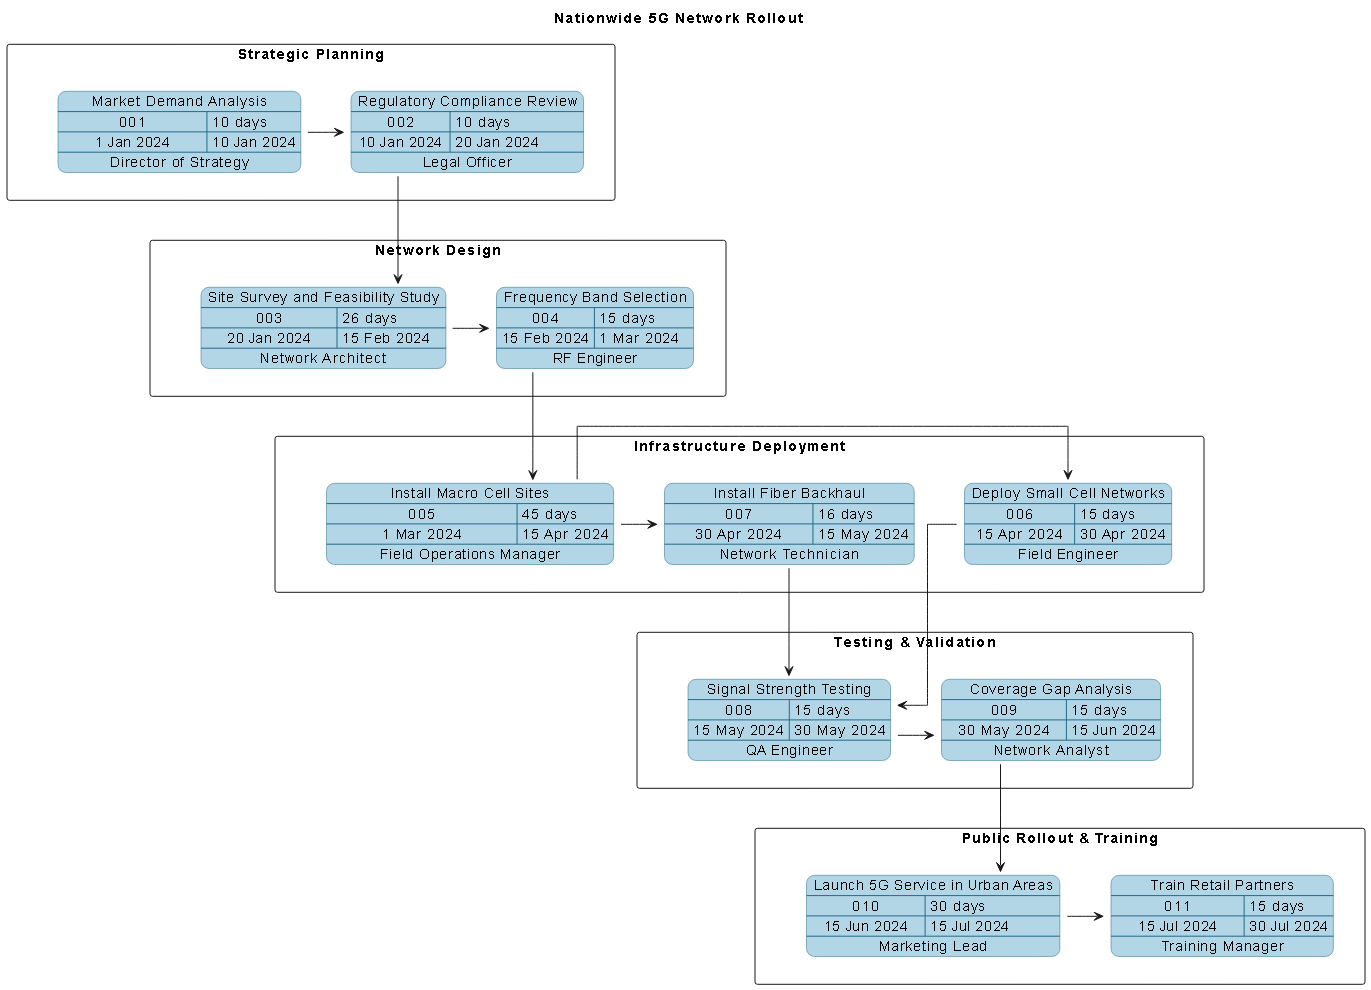
Tasks are grouped into five logical lanes:
- Strategic Planning: Market demand and regulatory review set the foundation.
- Network Design: Site surveys and frequency selection determine technical feasibility.
- Infrastructure Deployment: Macro and small cell installations, plus fiber backhaul, form the physical backbone.
- Testing & Validation: Signal strength and coverage gap analysis ensure quality.
- Public Rollout & Training: Urban launch and partner training enable market readiness.
2. Dependency Logic
Each task is linked via explicit dependencies, ensuring no premature execution. For example:
- Regulatory review cannot begin until market analysis is complete.
- Site surveys must finish before frequency bands are selected.
- Macro cell sites must be installed before small cells and fiber backhaul can proceed.
- Testing cannot start until infrastructure is in place.
This ensures the project follows a logical, risk-aware sequence, preventing bottlenecks and rework.
3. Critical Path Identification
The AI highlighted the critical path — the longest sequence of dependent tasks — which determines the project’s minimum duration:
Market Demand → Regulatory Review → Site Survey → Frequency Selection → Macro Cell Sites → Signal Testing → Coverage Gap → Urban Launch
With a total duration of 166 days, this path becomes the project’s priority. Any delay here directly impacts the launch date.
4. Parallelism & Efficiency
While some tasks are sequential, others run in parallel to save time. For instance:
- Small cell deployment and fiber backhaul both start after macro sites are installed — they can happen simultaneously.
- Signal testing and coverage gap analysis can overlap, though the latter depends on the former.
This parallel execution is a key efficiency lever in large-scale infrastructure projects.
Conversational Intelligence: The AI as a Modeling Partner
What sets Visual Paradigm apart isn’t just the diagram output — it’s the interactive intelligence behind it. The chatbot didn’t just respond to the initial prompt; it anticipated the user’s next questions and provided context-rich explanations.
When asked to explain the diagram, the AI didn’t stop at task names. It:
- Defined the purpose of each phase.
- Explained how dependencies prevent execution errors.
- Calculated the critical path duration with transparency.
- Highlighted key risks — such as the 45-day macro site installation being a major bottleneck.
These insights weren’t added later. They emerged in real time through a back-and-forth dialogue — a true collaboration between human intent and AI reasoning.
Beyond PERT: A Multi-Standard Modeling Platform
The Visual Paradigm AI Chatbot isn’t limited to PERT charts. It’s a full-spectrum modeling assistant capable of generating diagrams across multiple enterprise and technical standards:
- UML: For software design and system architecture.
- ArchiMate: For enterprise architecture, mapping business, application, and technology layers.
- SysML: For systems engineering, including requirements, behavior, and parametric modeling.
- C4 Model: For software architecture, visualizing context, containers, components, and code.
- Mind Maps, Org Charts, SWOT, PEST, and Data Charts: For strategic planning, stakeholder analysis, and data visualization.
Whether you’re designing a 5G network, mapping a digital transformation, or modeling a new product lifecycle, the AI Chatbot adapts to your domain — all through natural language interaction.
Conclusion: A Smarter Way to Model
Creating a nationwide 5G rollout plan requires more than a diagram. It demands foresight, precision, and the ability to manage complexity across teams and timelines.
Visual Paradigm’s AI Chatbot delivers all of this — not as a static output, but as a dynamic, intelligent collaborator. It turns abstract ideas into structured, actionable models through conversational design, ensuring every task, dependency, and timeline is aligned with real-world constraints.
Whether you’re a project manager, architect, or executive, this is how modern modeling should work: conversational, precise, and built for real-world impact.
Ready to build your next model? Explore the full 5G PERT chart session and see how the AI Chatbot can transform your planning process.