

From Concept to Screen: How AI Streamlines TV Series Development with a PERT Chart
Creating a television series is a complex, multi-phase endeavor that demands precise planning, clear task sequencing, and robust dependency tracking. Without a structured approach, delays in one phase can cascade across the entire production timeline. Enter the PERT chart — a powerful tool for visualizing project workflows, identifying critical paths, and managing timelines effectively.
With the Visual Paradigm AI Chatbot, transforming a high-level idea like “planning, producing, and releasing a TV series” into a detailed, actionable PERT chart is no longer a manual, time-consuming task. The AI acts as a collaborative modeling expert, turning natural language into structured project logic — instantly.
Interactive Journey: How the PERT Chart Evolved Through Conversation
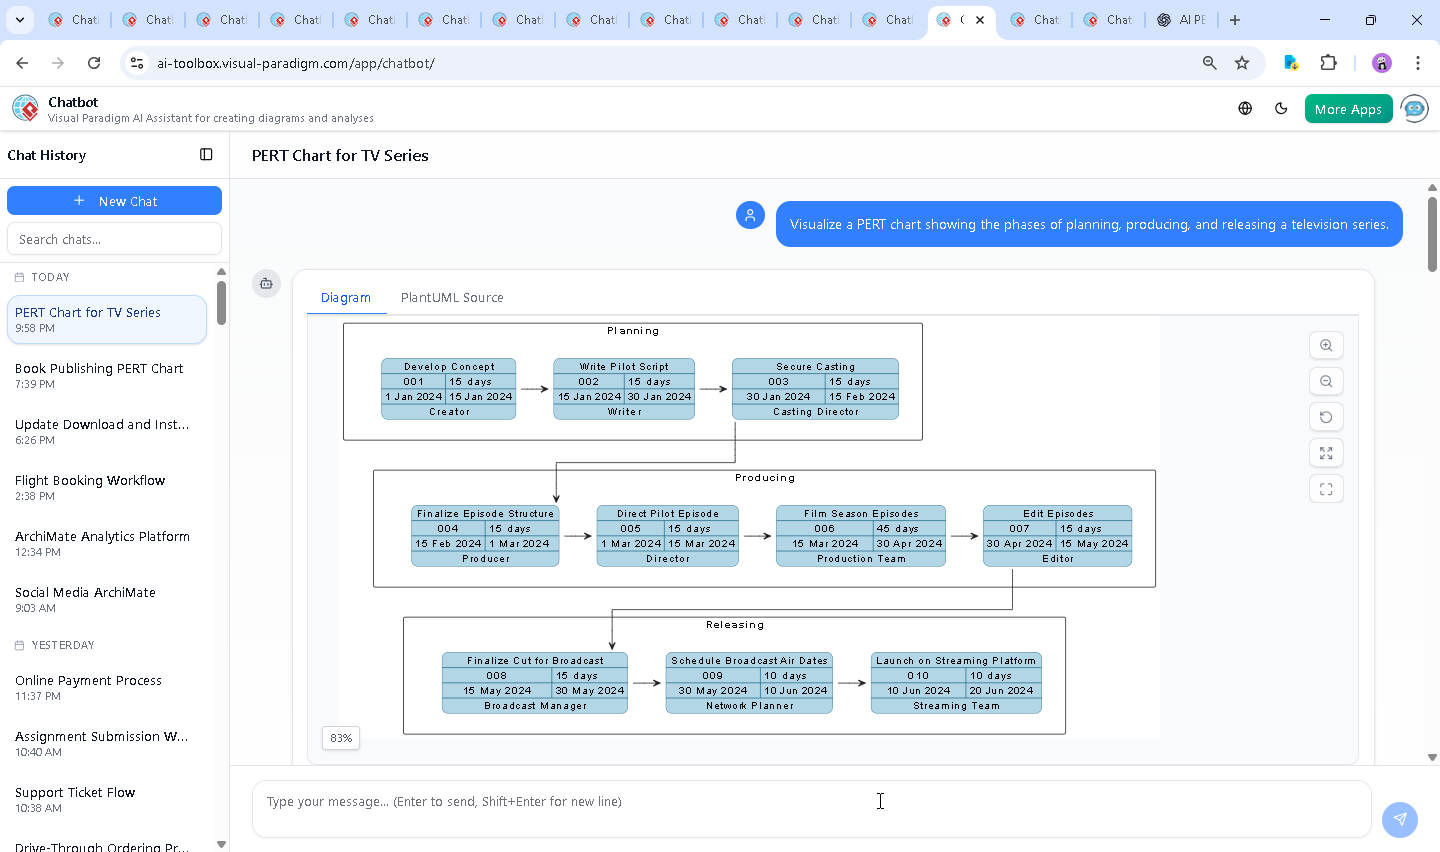
The journey began with a simple prompt: “Visualize a PERT chart showing the phases of planning, producing, and releasing a television series.” Within seconds, the AI generated a fully structured PERT diagram using PlantUML syntax, complete with task names, durations, responsible roles, and inter-task dependencies.
But the real value emerged in the conversation that followed. When the user asked, “Explain this diagram,” the AI didn’t just restate the data — it provided a layered breakdown, explaining the flow of each phase, the critical path, and the ripple effect of delays. This wasn’t a static output; it was a dynamic dialogue where the AI functioned as a project consultant.
For example, when the user requested clarification on a specific branch — “Explain this branch” — the AI didn’t default to generic definitions. Instead, it contextualized the dependency between “Write Pilot Script” and “Secure Casting”, highlighting why the script must precede casting. This level of insight demonstrates the AI’s ability to reason through project logic, not just generate diagrams.
Further refinements were made on demand: the user could ask for version updates, format changes, or risk buffers. Each request was handled with precision, proving that the AI isn’t just a diagram generator — it’s a modeling partner.
Logic Breakdown: Why This PERT Chart Works
The PERT chart is built on a foundation of clear task sequencing and dependency mapping. Let’s unpack the source logic and the strategic decisions behind it:
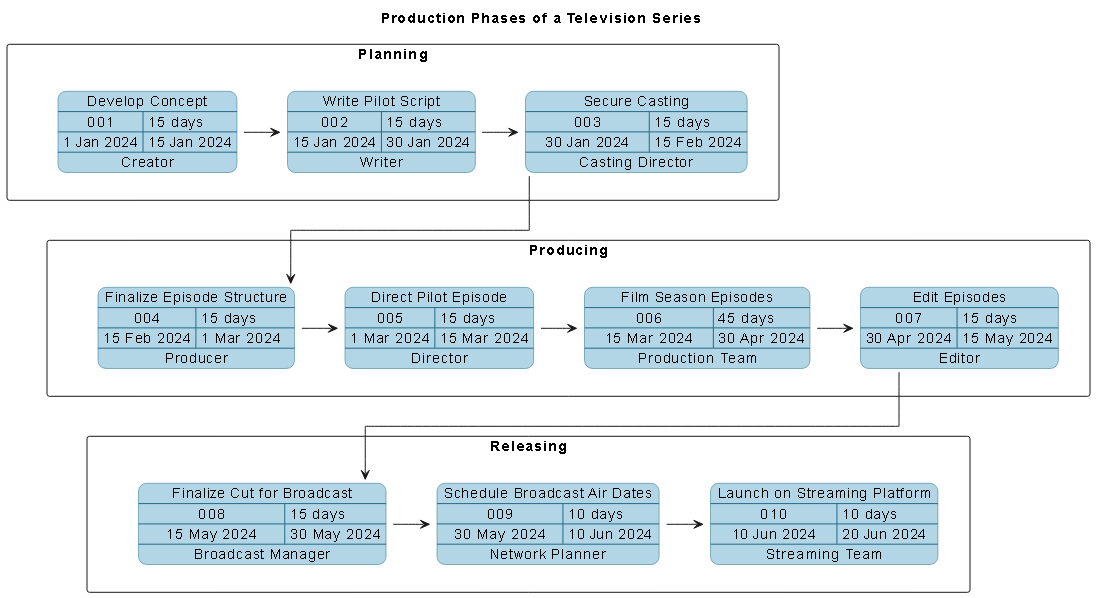
Phase 1: Planning (January 2024)
Tasks are arranged in a linear sequence:
- Develop Concept (1 Jan – 15 Jan): The foundational step. No script or casting can happen without a solid concept.
- Write Pilot Script (15 Jan – 30 Jan): Built on the concept, this task defines the show’s tone, characters, and story arc.
- Secure Casting (30 Jan – 15 Feb): Only after the script is finalized can actors be cast, ensuring alignment with character descriptions.
Each task is marked with a clear startDate, finishDate, and durationInDays. The $dependency function ensures that no task starts before its predecessor finishes.
Phase 2: Producing (February – May 2024)
Production begins only after casting is complete:
- Finalize Episode Structure (15 Feb – 1 Mar): Determines how many episodes, their arcs, and episode order.
- Direct Pilot Episode (1 Mar – 15 Mar): The first episode is directed, setting the visual tone.
- Film Season Episodes (15 Mar – 30 Apr): The bulk of filming, spanning 45 days — the longest single task, indicating a high resource load.
- Edit Episodes (30 Apr – 15 May): Post-production work that ensures narrative coherence and quality.
The 45-day filming window is a key bottleneck. Any delay here directly impacts the entire timeline, reinforcing the importance of the critical path.
Phase 3: Releasing (May – June 2024)
Final delivery steps:
- Finalize Cut for Broadcast (15 May – 30 May): The final edit is approved for airing.
- Schedule Broadcast Air Dates (30 May – 10 Jun): The network locks in airing slots.
- Launch on Streaming Platform (10 Jun – 20 Jun): The show becomes available on digital platforms.
These tasks are sequential and time-sensitive. The launch depends on broadcast scheduling, which in turn depends on the final cut.
Why PERT Over Gantt?
While Gantt charts show task durations and overlaps, PERT excels in visualizing dependencies and identifying the critical path. In this case, the critical path spans 90 days — from concept to streaming launch — and any delay in this chain delays the entire project.
The use of $tasksInLane and $dependency in the PlantUML script ensures that the chart is not only visually clean but also logically sound, with no ambiguous task relationships.
Conversational Value: The AI as a Modeling Consultant
What sets Visual Paradigm apart is how the AI Chatbot doesn’t just generate diagrams — it engages in a collaborative design process. The chat history shows a real-time exchange where:
- The user asked for a visualization.
- The AI delivered a fully structured PERT chart.
- The user requested explanation — and received a breakdown of dependencies, timelines, and risk implications.
- Follow-up queries like “Explain this branch” were answered with context-aware reasoning, not canned responses.
This isn’t automation — it’s intelligent co-design. The AI understands project management principles and applies them in real time.
Platform Versatility: Beyond PERT Charts
The Visual Paradigm AI Chatbot isn’t limited to PERT charts. It’s a full-stack visual modeling assistant capable of handling diverse standards and use cases:
- UML: For software design, system architecture, and behavior modeling.
- ArchiMate: For enterprise architecture, modeling business, application, and technology layers.
- SysML: For systems engineering, including requirements, behavior, and parametric modeling.
- C4 Model: For software architecture, visualizing context, containers, components, and code.
- Mind Maps, Org Charts, SWOT, PEST, and Data Charts: For strategy, planning, and data visualization.
Whether you’re a project manager mapping out a TV series, an architect designing a digital system, or a strategist analyzing market trends, the AI Chatbot adapts to your domain — all through natural conversation.
Conclusion & CTA
Transforming a vision into a production timeline is no longer a manual chore. With the Visual Paradigm AI Chatbot, you can define your project in plain language and receive a professional-grade PERT chart — complete with logic, dependencies, and timeline clarity — in seconds.
Explore how the AI can help you model your next project, whether it’s a software system, enterprise strategy, or media production. Try the live demo and experience the future of visual modeling — where AI doesn’t just generate diagrams, it understands them.