

Visualizing the Smart City Pulse: How AI Powers Real-Time Traffic Intelligence
Designing a resilient and responsive traffic management system for a modern smart city demands more than static blueprints. It requires a living architecture—one that captures not just physical components, but the dynamic data flows and intelligent decision-making that keep urban mobility efficient. The challenge lies in translating complex interactions between roadside sensors, centralized control centers, and cloud-based analytics into a clear, accurate, and actionable model.
Enter the Visual Paradigm AI Chatbot—an intelligent modeling partner that doesn’t just generate diagrams, but collaborates in real time. Instead of drafting from scratch, users engage in a conversational design process, refining ideas through natural language. This approach transforms abstract concepts into precise technical models, with every interaction deepening the system’s intelligence.
From Idea to Insight: A Collaborative Design Journey
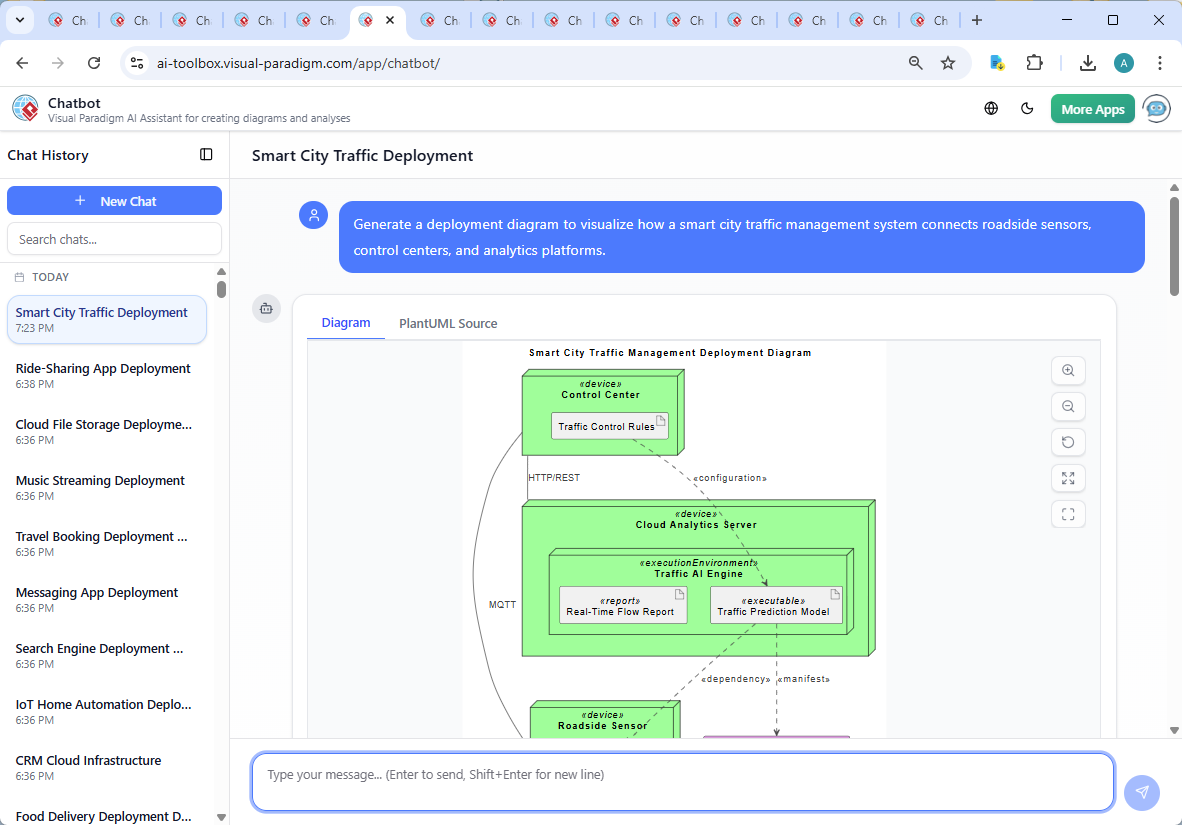
The journey began with a simple prompt: “Generate a deployment diagram to visualize how a smart city traffic management system connects roadside sensors, control centers, and analytics platforms.”
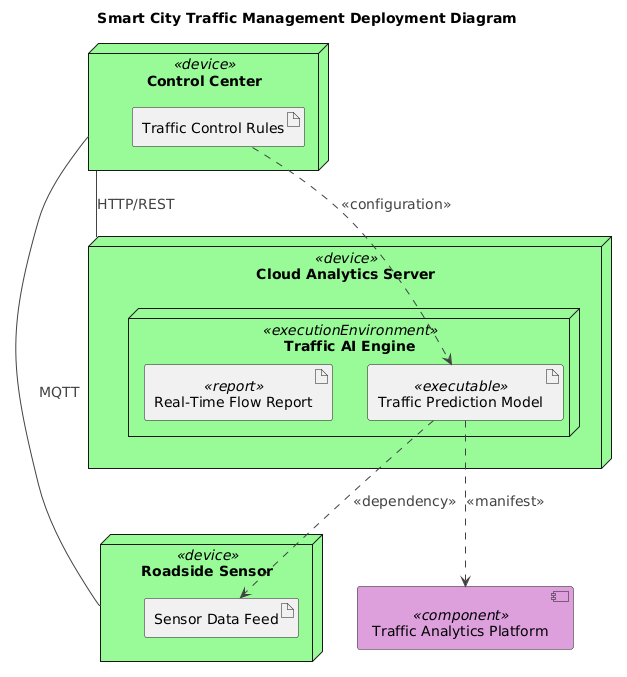
Within seconds, the Visual Paradigm AI Chatbot delivered a fully structured PlantUML representation of the deployment, complete with nodes, components, artifacts, and clear relationships. The initial output included:
- Roadside Sensor as a device node generating real-time data.
- Control Center handling local coordination and data aggregation.
- Cloud Analytics Server hosting the Traffic AI Engine and predictive models.
- Real-Time Flow Report and Traffic Prediction Model as key artifacts.
But the conversation didn’t stop there. The user asked: “Can you explain how the Traffic AI Engine uses the Real-Time Flow Report to improve traffic predictions?”
The AI responded with a detailed, layered explanation—highlighting the feedback loop between data ingestion, model refinement, and adaptive control. It didn’t just describe the diagram; it interpreted its purpose, revealing how the system evolves over time. This level of contextual insight is what distinguishes Visual Paradigm’s AI from basic diagram generators.
When the user requested further clarification—“Explain this branch”—the AI didn’t re-output the diagram. Instead, it dissected the dependency chain, showing how the Real-Time Flow Report serves as both input and validation signal for the AI engine, enabling self-correction and continuous learning.
Each exchange refined the model’s semantic depth, proving that the AI isn’t just a tool—it’s a modeling consultant that understands the ‘why’ behind every element.
Decoding the Deployment Logic: Why the Structure Matters
The final deployment diagram is not just visually clean—it’s semantically precise. Let’s break down the logic:
1. Physical vs. Logical Separation
By using node for physical devices (e.g., Control Center, Cloud Analytics Server) and component for software systems (e.g., Traffic Analytics Platform), the diagram clearly separates hardware from software layers. This is essential for deployment planning and system scalability.
2. Dynamic Data Flows
Communication links are not generic. The diagram specifies:
MQTTbetweenControl CenterandRoadside Sensor— ideal for low-latency, lightweight sensor data transmission.HTTP/RESTbetweenControl CenterandCloud Analytics Server— suitable for structured data exchange and API-based integration.
3. Intelligent Component Dependencies
The trafficpredictionmodel_executable is shown as:
..> trafficanalyticsplatform_component— indicating it is deployed as a manifest (i.e., part of the platform)...> sensordatafeed_artifact— showing it depends on live sensor input...> trafficcontrolrules_artifact— highlighting that it uses configuration rules to adjust behavior.
These dependencies reveal how the AI engine is not isolated—it’s embedded in a broader ecosystem of data, rules, and outputs.
4. Closed-Loop Intelligence
The diagram implicitly supports a feedback loop:
Real-Time Flow Report → AI Engine → Updated Predictions → New Control Decisions → New Sensor Data
This loop enables the system to self-optimize—responding to anomalies, learning from patterns, and proactively adjusting traffic signals. It’s the foundation of a true smart city.
Why the AI Chatbot Isn’t Just a Diagram Generator
What sets Visual Paradigm apart is the depth of intelligence embedded in its AI Chatbot. It doesn’t just render shapes—it understands the semantics of architecture, the constraints of deployment, and the logic of real-time systems.
During the conversation, the AI didn’t merely answer questions—it guided the user toward better design decisions. For example:
- When asked to explain a relationship, it didn’t just repeat the diagram. It clarified the purpose: “The AI engine uses the Real-Time Flow Report to validate predictions and adjust its model.”
- When prompted to refine the logic, it suggested architectural improvements—like using
executionEnvironmentto encapsulate the AI engine, ensuring clarity in deployment.
This level of insight is not accidental. The AI Chatbot is trained on thousands of enterprise architecture patterns, including UML, ArchiMate, SysML, C4 Model, and more. It can switch between standards seamlessly, ensuring consistency across projects.
Whether you’re modeling a microservices-based control center (using component and executionEnvironment), designing an enterprise-wide architecture with Archimate layers, or mapping system behavior with SysML behavior diagrams, the AI adapts—offering guidance, generating code, and validating logic.
One Platform, Infinite Architectures
Visual Paradigm isn’t limited to deployment diagrams. Its AI Chatbot is a full-spectrum modeling assistant, capable of:
- UML: Class, sequence, activity, and state diagrams for software design.
- ArchiMate: Enterprise architecture modeling with business, application, and technology layers.
- SysML: For systems engineering, including requirements, block definition, and internal block diagrams.
- C4 Model: Context, containers, components, and code views for software architecture.
- Visual Planning Tools: Mind maps, PERT charts, org charts, SWOT, and data visualization (column, pie, line, area charts).
This versatility makes it the only platform where a single AI assistant can support everything from city-wide infrastructure to software development pipelines—without switching tools or losing context.
Conclusion: The Future of Architectural Design is Conversational
Smart city traffic management is more than a technical challenge—it’s a human-centered system that demands precision, adaptability, and foresight. The Visual Paradigm AI Chatbot turns this vision into reality by transforming design into dialogue.
From the initial prompt to the final diagram, every step was guided by intelligent collaboration. The AI didn’t just draw a picture—it explained it, refined it, and helped the user understand the system’s intelligence at every level.
Ready to build smarter systems with AI-driven clarity? Explore the full capabilities of Visual Paradigm’s AI Chatbot and start designing with confidence.
Try it now: Join the Smart City Traffic Deployment Session