

Designing a Scalable Leadership Structure for a Fast-Growing Startup
Scaling a startup demands more than just momentum—it requires a clear, adaptable organizational structure that aligns leadership, engineering, product, and sales under a unified vision. For fast-growing startups, traditional static org charts often fall short, failing to reflect dynamic team relationships or strategic priorities. Enter the Visual Paradigm AI Chatbot, not just a diagram generator but a collaborative modeling partner that transforms high-level ideas into precise, actionable visual structures through natural conversation.
From Idea to Insight: The Interactive Journey of Building the Org Chart
The process began with a simple prompt: “Draw an organization chart that captures the leadership, engineering, product, and sales teams of a fast-growing startup.” Within seconds, the AI Chatbot delivered a structured PlantUML representation of the organization, already reflecting key leadership roles and functional departments.
But the real value emerged in the follow-up dialogue. When asked to “Explain the reporting structure between the CEO and the CTO,” the AI didn’t just restate the diagram—it contextualized it, clarifying that the CTO reports directly to the CEO, a critical decision point in early-stage startups. This wasn’t a static output; it was a conversation with intent.
The AI then deepened the narrative: “Why does this structure work in a fast-growing startup?” It explained how direct reporting enables strategic alignment, agile decision-making, and technical accountability—insights that would take hours to research manually.
Each exchange refined the model, turning a basic org chart into a strategic blueprint. The AI didn’t just draw lines—it explained the rationale behind them, ensuring the structure wasn’t just visually accurate but operationally sound.
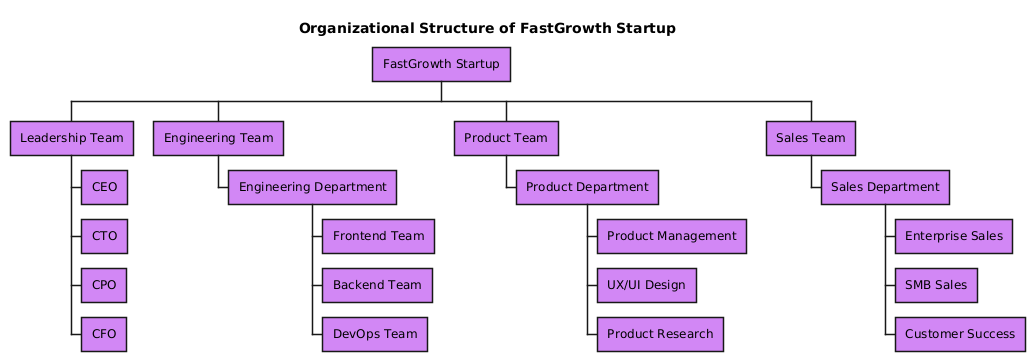
Visualizing the FastGrowth Startup Structure
Decoding the Logic: Why This Structure Works
The organization chart is built using PlantUML’s WBS (Work Breakdown Structure) syntax, a deliberate choice for clarity and scalability. Here’s how the structure supports startup agility:
- Leadership at the Top: The CEO sits at the apex, overseeing all functions. This central authority ensures strategic coherence across departments.
- CTO Reporting Directly to CEO: This reflects the startup’s need for tight integration between technology and business goals. The CTO is not siloed—instead, they act as a strategic enabler, translating vision into technical execution.
- Engineering as a Multi-Track Team: The separation of Frontend, Backend, and DevOps teams enables specialization while maintaining cross-functional collaboration—critical as the product scales.
- Product Team with Research and Design Focus: The inclusion of Product Research and UX/UI Design signals a customer-centric mindset, essential for product-led growth.
- Sales with Customer Success Integration: The presence of Customer Success within the Sales Department ensures retention is built into the go-to-market strategy, not treated as an afterthought.
Each node is not just a role—it’s a strategic lever. The AI’s choice of WBS notation over traditional org chart styles reflects a deeper understanding: this isn’t just about hierarchy, but about how work flows and how accountability is structured.
The AI Chatbot as a Modeling Consultant
What sets Visual Paradigm apart is that the AI doesn’t just respond—it advises. The conversation wasn’t a series of one-off edits. It evolved like a design review with a seasoned architect.
When the user asked to “refine the logic”, the AI didn’t default to a generic template. Instead, it provided a rationale: “In fast-growing startups, centralized tech leadership prevents misalignment and technical debt.” This kind of insight—derived from real-world startup patterns—is the hallmark of an intelligent modeling assistant.
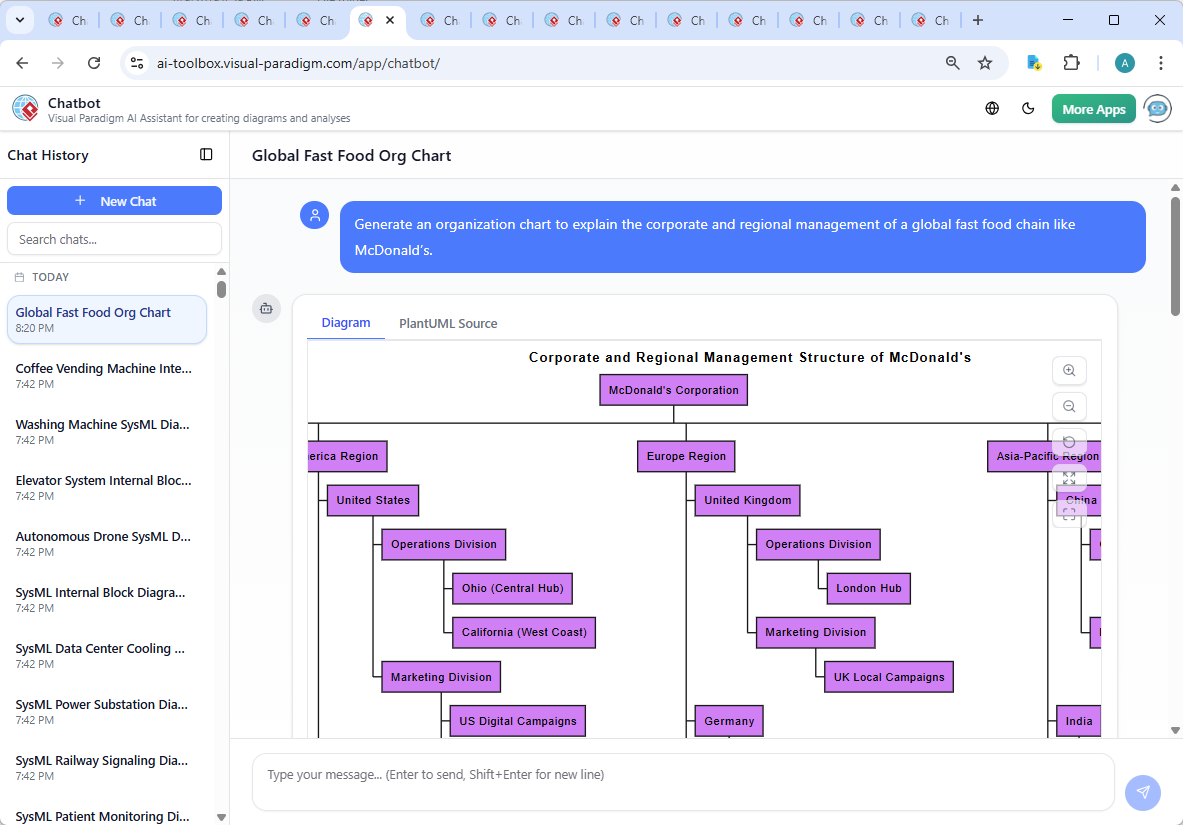
And the proof? The Visual Paradigm AI Chatbot interface, where every query, response, and refinement is logged, allowing users to trace the evolution of the model—just like a design journal.
Beyond Org Charts: A Full-Spectrum AI Modeling Platform
The Visual Paradigm AI Chatbot isn’t limited to organization charts. It’s a full-fledged, multi-standard modeling assistant capable of generating diagrams across UML, ArchiMate, SysML, C4 Model, Mind Maps, PERT Charts, SWOT, PEST, and various data visualization types (e.g., column, area, pie, line charts).
Whether you’re designing a system architecture with SysML, mapping enterprise capabilities with ArchiMate, or visualizing a product roadmap in C4, the AI adapts. It understands the semantics of each standard and generates diagrams that are not only accurate but semantically meaningful.
This versatility makes Visual Paradigm not just a diagramming tool—but a conversational design environment where strategy, execution, and documentation coexist in real time.
Conclusion: Build Smarter, Faster, Together
Creating an organization chart for a fast-growing startup isn’t about drawing boxes and lines. It’s about modeling how people and teams work together to achieve scale. With Visual Paradigm’s AI Chatbot, you don’t need to be a design expert. You just need to think—and the AI does the rest.
Explore the shared session to see how this org chart was built in real time. Experience the power of an AI-powered visual modeling platform that listens, reasons, and collaborates.