

Designing a Future-Ready Energy Utility: The GreenPower Energy Organizational Structure
Creating a clear, scalable organizational structure for a modern energy utility is more than a hierarchy—it’s a blueprint for operational resilience, innovation, and sustainability. Traditional diagramming tools often fall short when translating complex enterprise dynamics into actionable visual models. That’s where the Visual Paradigm AI Chatbot steps in, transforming high-level concepts into precise, collaborative designs through natural conversation.
From Vision to Visual: The Interactive Design Journey
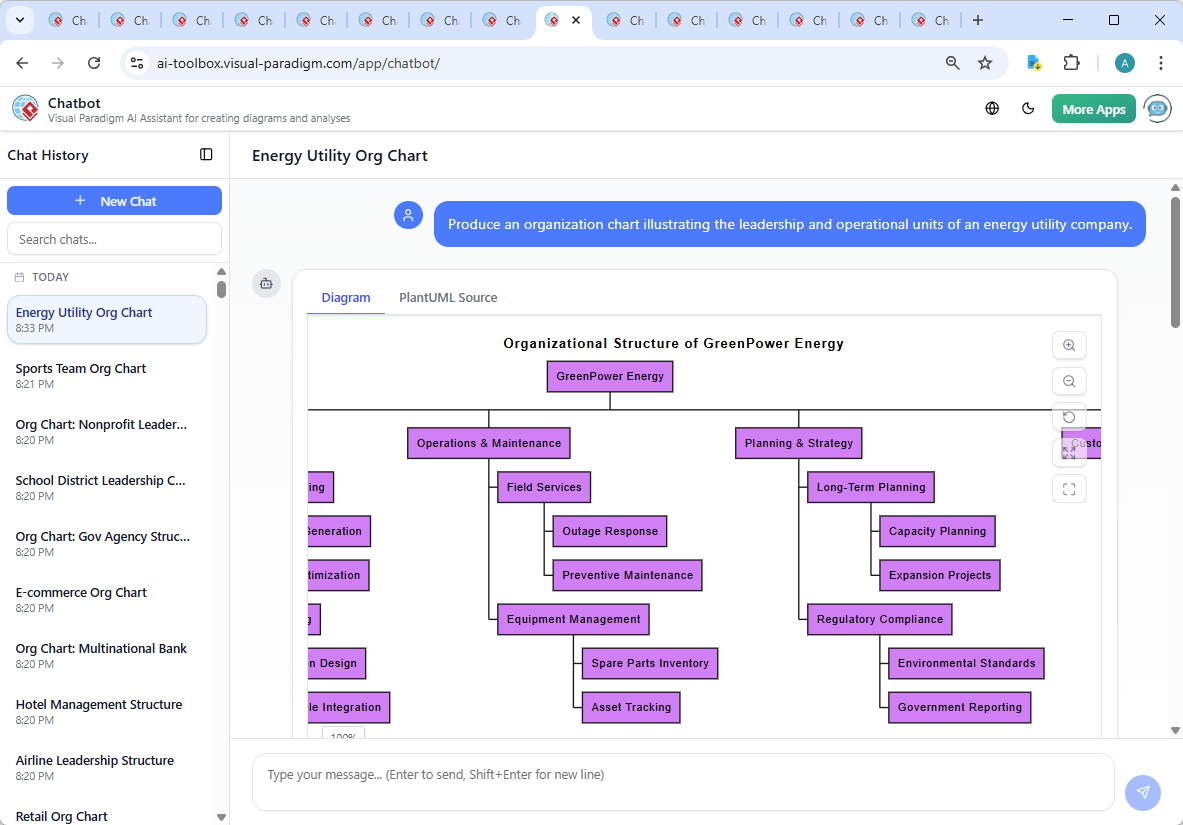
It began with a simple request: “Produce an organization chart illustrating the leadership and operational units of an energy utility company.” The AI Chatbot responded instantly—not with a static template, but with a structured, hierarchical PlantUML representation of GreenPower Energy’s organizational structure. This wasn’t just a diagram; it was a living model shaped by dialogue.
The first version laid out the core divisions: Operations, Engineering, Planning & Strategy, Customer Services, and Sustainability & R&D. But the real intelligence emerged in the follow-up. When the user asked, “How does the Renewable Energy R&D unit collaborate with the Grid Optimization team?”, the AI didn’t just point to a link—it explained the collaboration framework in depth, detailing joint project teams, data sharing, technical workshops, and feedback loops.
Each clarification was met with a refined response, demonstrating the AI’s ability to act as a modeling consultant. The user could say, “AI, refine the logic on the feedback loop”, and the AI would restructure the narrative to emphasize real-time performance integration. This iterative, conversational approach ensures the model evolves not just visually, but strategically.
Decoding the Structure: Why This Design Works
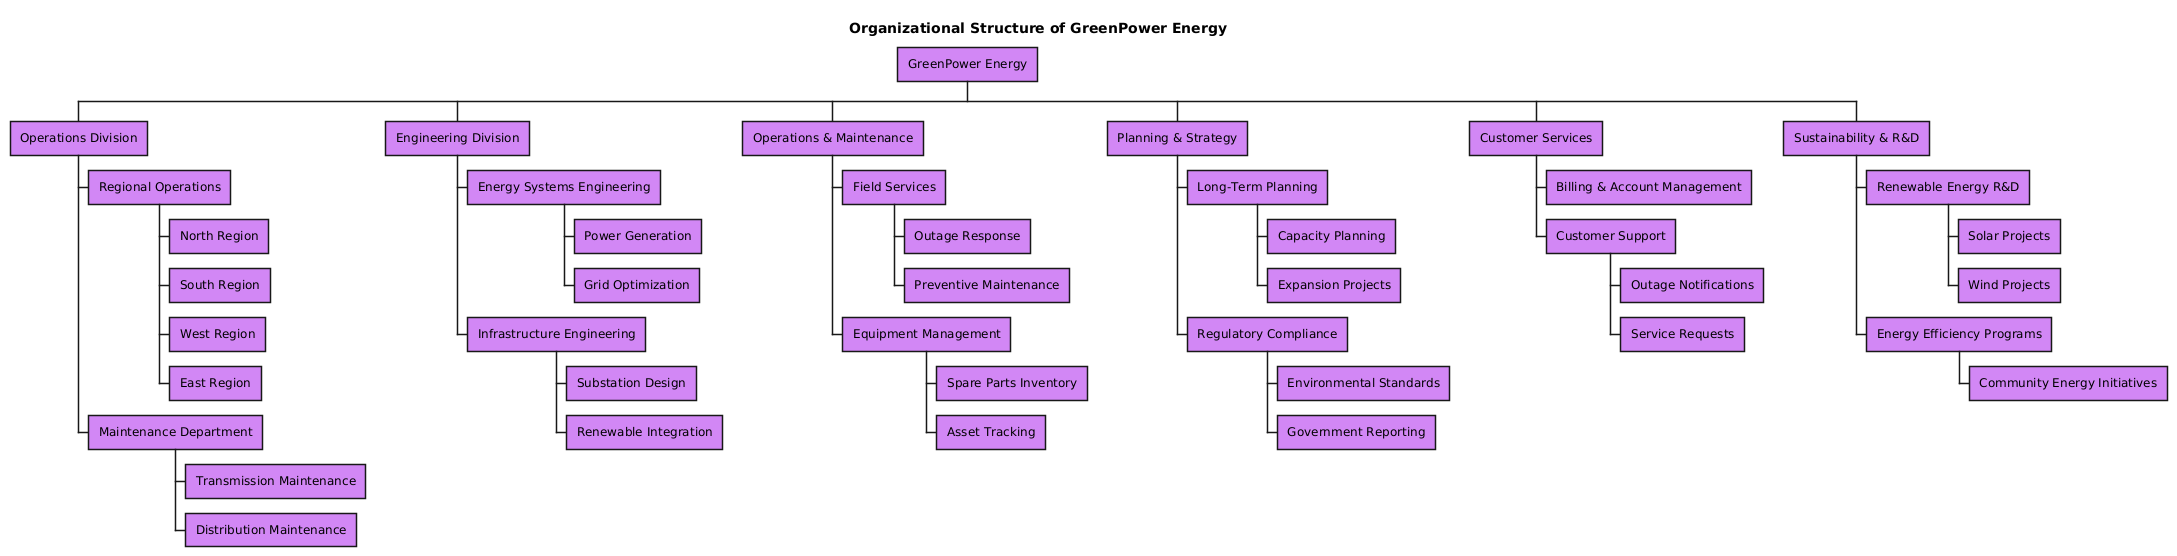
The diagram reflects a modern, agile energy utility where innovation and operations are tightly integrated. Here’s how the logic unfolds:
- Leadership Foundation: The top-level node, GreenPower Energy, establishes the enterprise boundary. Its divisions are organized by function and value delivery.
- Operations Division: Focuses on execution—Regional Operations (North, South, West, East) handle local delivery, while Maintenance ensures grid reliability through transmission and distribution upkeep.
- Engineering Division: Drives innovation and infrastructure integrity. Energy Systems Engineering handles power generation and grid optimization, while Infrastructure Engineering focuses on substation design and renewable integration.
- Operations & Maintenance: Bridges design and field execution. Field Services manages outage response and preventive maintenance, while Equipment Management tracks assets and spare parts.
- Planning & Strategy: Ensures long-term viability. Capacity planning and expansion projects align with regulatory compliance and environmental standards.
- Customer Services: Delivers end-user experience through billing, account management, and proactive outage notifications.
- Sustainability & R&D: The innovation engine. Renewable Energy R&D explores solar and wind projects, while Energy Efficiency Programs engage communities in sustainable practices.
The PlantUML syntax used—@startwbs—was chosen for its clarity in hierarchical modeling. The visual hierarchy reflects reporting lines, functional ownership, and cross-unit collaboration, with color-coded nodes (purple background) enhancing readability and differentiation.
Conversational Intelligence in Action
What sets Visual Paradigm apart is not just the output, but the dialogue that shapes it. The AI Chatbot doesn’t just generate diagrams—it engages in expert-level discussion, interpreting intent and refining design based on context.
For example, when asked about the R&D-Grid Optimization relationship, the AI didn’t offer a generic answer. Instead, it outlined a structured collaboration framework with six key mechanisms:
- Joint project teams for feasibility studies.
- Data sharing from pilot projects.
- Bi-weekly technical workshops.
- Alignment with long-term planning.
- Pilot deployment in microgrids.
- Feedback loops for continuous improvement.
This level of insight transforms the diagram from a static visual into a strategic narrative—showing how innovation is operationalized.
More Than Just Org Charts: A Full AI-Powered Modeling Suite
The Visual Paradigm AI Chatbot isn’t limited to organization charts. It supports a full spectrum of modeling standards, making it the only platform that can serve as a unified environment for enterprise architects and software teams alike:
- UML: For software design and system behavior modeling.
- ArchiMate: For enterprise architecture with clear business, application, and technology layers.
- SysML: For systems engineering, including requirements, behavior, and parametric modeling.
- C4 Model: For software architecture visualization at multiple abstraction levels.
- Mind Maps, PERT Charts, SWOT, PEST, and Data Charts: For strategic planning, project scheduling, and data-driven decision-making.
This versatility means that whether you’re designing a cloud-native application, mapping enterprise strategy, or visualizing a supply chain, the same AI assistant guides you through every step—maintaining consistency, clarity, and depth.
Conclusion: Build Smarter, Collaborate Faster
The GreenPower Energy organization chart isn’t just a visual hierarchy—it’s a living model of how modern energy utilities must operate: adaptive, integrated, and innovation-driven. With Visual Paradigm’s AI Chatbot, this model was co-created through intelligent conversation, not isolated drafting.
Ready to design your next enterprise model with the same level of insight and precision? Explore the shared session and experience how the AI Chatbot turns ideas into strategic visuals—fast, accurate, and collaborative.