

Designing the Future of Mobility: An AI-Powered Organizational Blueprint for Automotive Innovation
Creating a clear, scalable, and future-ready organizational structure is critical for automotive manufacturers navigating the shift toward electric, connected, and autonomous vehicles. Traditional diagramming tools often fall short—requiring manual layout, rigid templates, and deep technical knowledge. But with Visual Paradigm’s AI Chatbot, building a sophisticated organization chart isn’t just faster; it’s conversational, intelligent, and deeply strategic.
From Idea to Structure: A Collaborative Design Journey
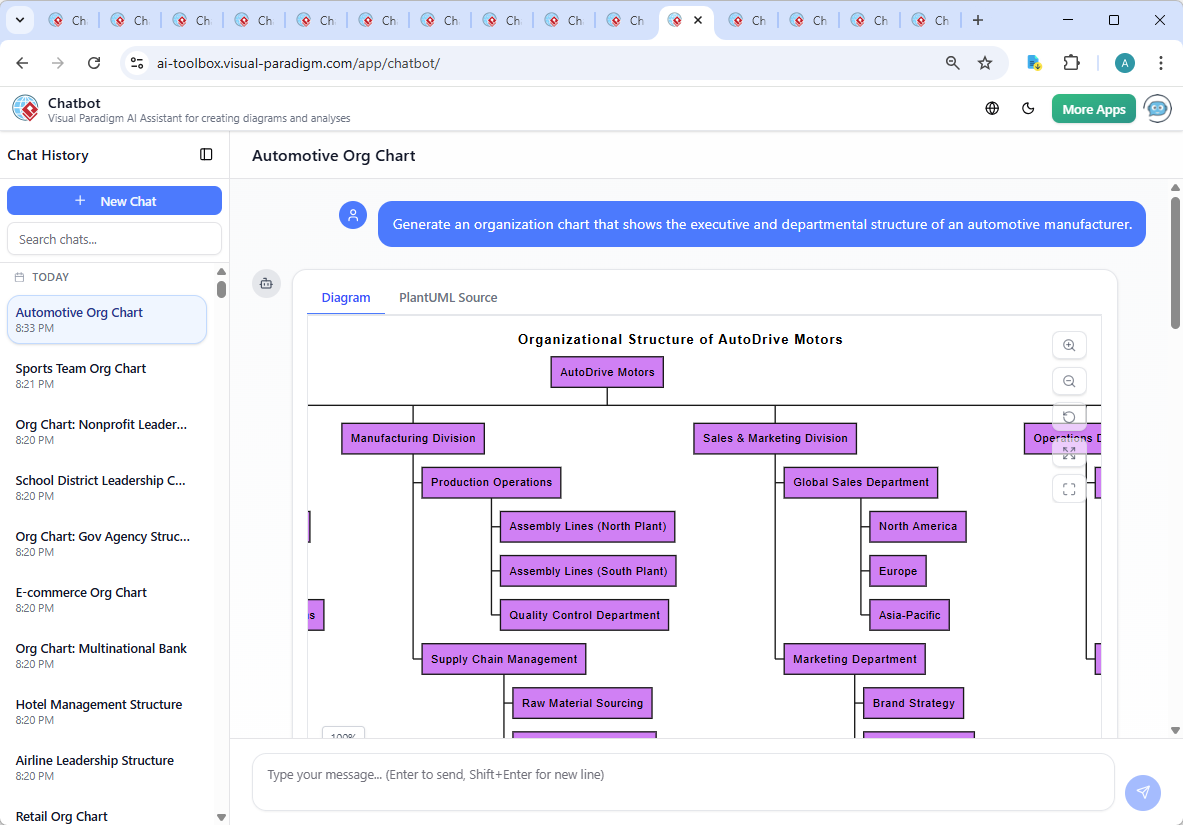
The journey began with a simple request: “Generate an organization chart that shows the executive and departmental structure of an automotive manufacturer.” Within seconds, the Visual Paradigm AI Chatbot delivered a fully structured WBS (Work Breakdown Structure) representation in PlantUML syntax—complete with executive leadership, R&D, manufacturing, sales, operations, and aftermarket divisions.
But the real power emerged in the follow-up dialogue. When asked to “Explain the role of the Chief Technical Officer (CTO) in the Research & Development Division,” the AI didn’t just define the role—it contextualized it within the broader innovation ecosystem of a modern automotive company. It outlined how the CTO shapes technological vision, leads cross-functional teams, drives sustainability initiatives, and ensures compliance with global safety and emissions standards.
This wasn’t a static diagram. It was a living model shaped by dialogue—each query refining the logic, deepening the insight, and reinforcing the strategic alignment of each department. The AI didn’t just generate a chart; it acted as a modeling consultant, offering expertise in organizational design, technical leadership, and future-readiness.
Decoding the Structure: Why This Organization Chart Works
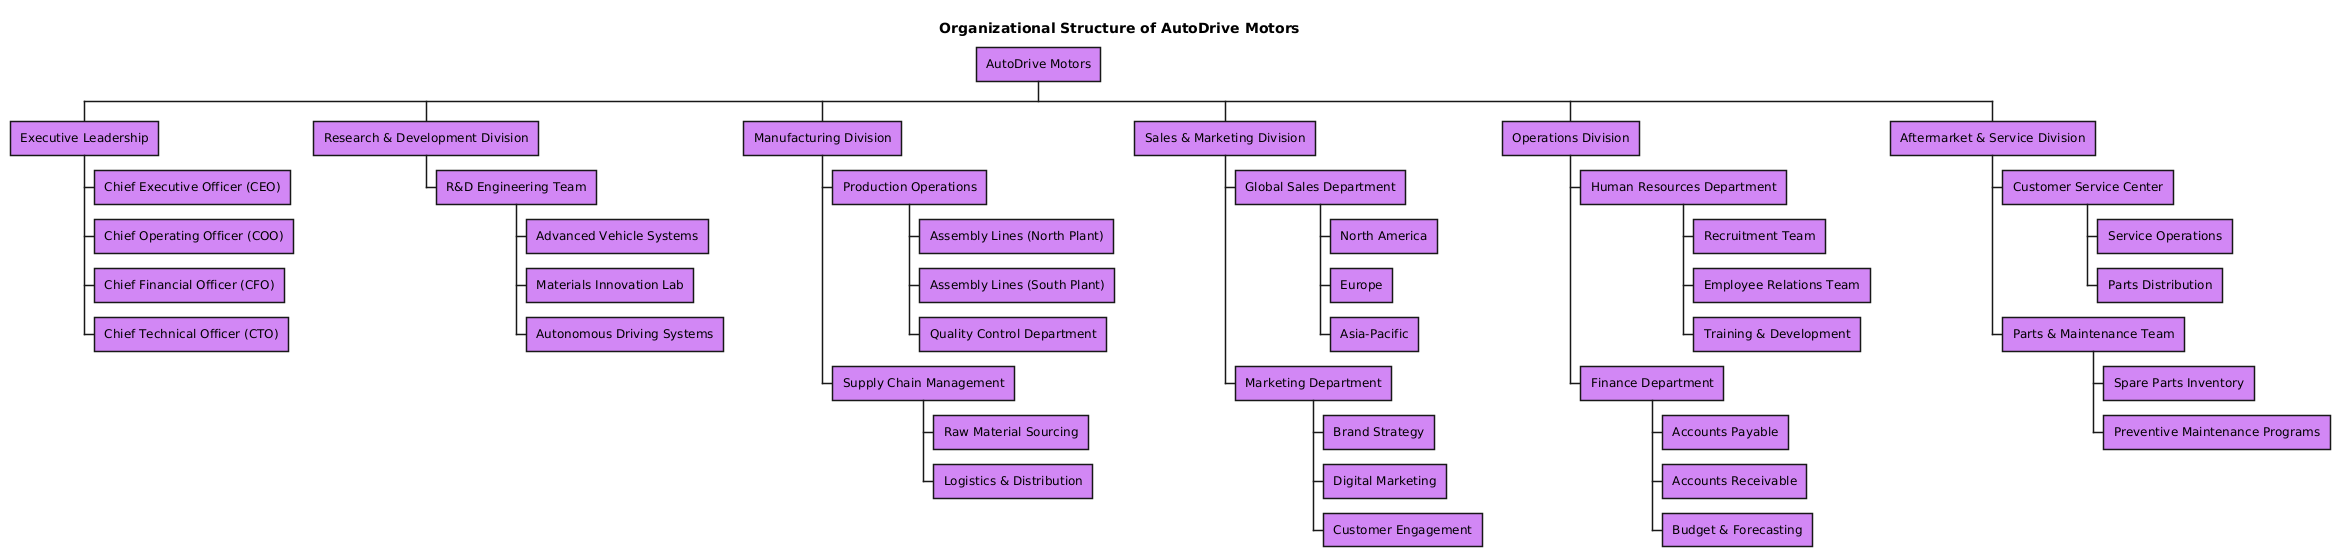
The generated organization chart for AutoDrive Motors is built on a hierarchical WBS (Work Breakdown Structure) model, which is ideal for visualizing complex enterprise structures. Here’s how each layer was designed for clarity and strategic relevance:
- Executive Leadership at the top ensures accountability and strategic direction. The CEO, COO, CFO, and CTO represent the core decision-making body.
- Research & Development Division is structured around innovation pillars: Advanced Vehicle Systems, Materials Innovation, and Autonomous Driving—reflecting the company’s focus on next-gen mobility.
- Manufacturing Division separates Production Operations (with regional assembly lines) from Supply Chain Management, emphasizing both output and logistics efficiency.
- Sales & Marketing Division is regionally segmented (North America, Europe, Asia-Pacific), enabling localized strategies while maintaining global brand consistency.
- Operations Division includes HR and Finance—critical for sustaining talent and financial health in a capital-intensive industry.
- Aftermarket & Service Division reflects the growing importance of customer retention, parts availability, and preventive maintenance in the EV and connected vehicle era.
The choice of WBS notation over traditional org charts was intentional. It allows for both hierarchical clarity and scalability—perfect for complex, multi-tiered organizations where cross-functional alignment is essential. The AI recognized this need and applied the right visual language from the start.
Conversational Intelligence: The AI That Understands Your Vision
What sets Visual Paradigm apart isn’t just the diagram—it’s the conversation. The AI Chatbot didn’t stop at generating a structure. It anticipated follow-up questions, offered contextual depth, and validated design choices.
When the user asked for a deeper explanation of the CTO’s role, the AI responded not just with a definition, but with a full strategic profile: how the CTO drives innovation roadmaps, manages partnerships, ensures safety compliance, and leads sustainability efforts. This level of insight transforms the diagram from a static image into a living strategic document.
The chat history reveals a true collaboration: the user posed a question, the AI delivered expert analysis, and the user could then refine or expand—such as asking for role clarifications or structure adjustments. This iterative, conversational loop is the hallmark of an intelligent modeling platform.
Beyond Org Charts: A Unified Platform for Enterprise Modeling
While this example focused on an organization chart, the Visual Paradigm AI Chatbot is not limited to one diagram type. It seamlessly supports a full spectrum of modeling standards, including:
- UML – For software architecture, system design, and component modeling
- ArchiMate – For enterprise architecture, aligning business, application, and technology layers
- SysML – For systems engineering, especially in complex domains like autonomous vehicles and embedded systems
- C4 Model – For software architecture visualization, showing containers, components, and code
- Mind Maps, PERT Charts, SWOT, PEST, and data visualization – For strategic planning, project scheduling, and business analysis
This versatility means that teams across IT, engineering, product, and executive leadership can use a single platform to design, collaborate, and communicate—without switching tools or learning new interfaces.
Shape the Future of Your Organization—With AI at Your Side
Whether you’re designing a new R&D division, aligning cross-functional teams, or building a digital twin of your enterprise, Visual Paradigm’s AI Chatbot turns abstract ideas into precise, intelligent models—through natural conversation.
Explore how your organization can evolve with the same level of strategic clarity and technical depth. Try the shared session and experience the future of visual modeling.