

Visualizing the Future: How AI Shapes NASA’s Leadership and Mission Structure
Designing a comprehensive organizational structure for a space agency like NASA isn’t just about listing titles—it’s about mapping strategic intent, scientific vision, and operational execution. The challenge lies in capturing both hierarchy and purpose, especially when leadership, mission teams, and oversight functions must work in seamless alignment across complex domains.
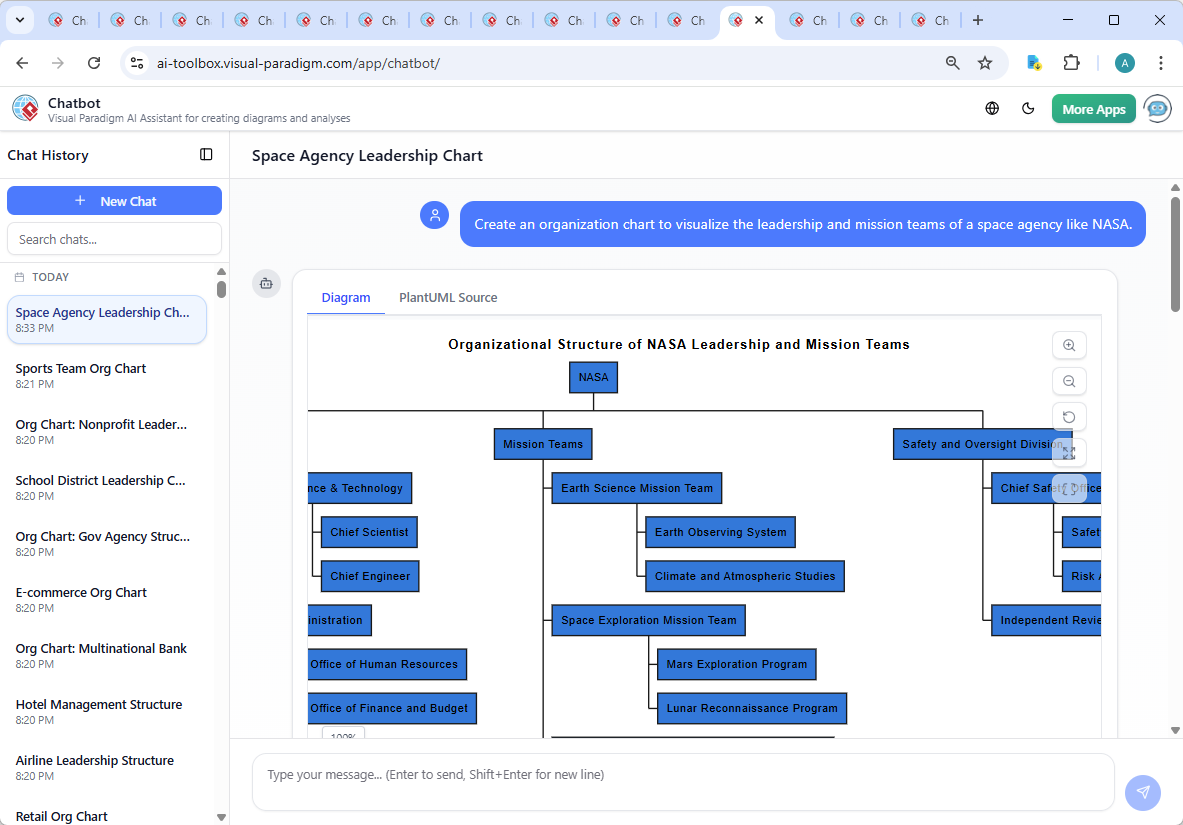
Enter the Visual Paradigm AI Chatbot—not just a diagram generator, but a conversational modeling partner. With its ability to interpret natural language, refine structure, and explain roles in real time, it transforms abstract concepts into precise, actionable visual models. This is how the AI helped craft a detailed organization chart for NASA’s leadership and mission teams, evolving through dialogue to reflect real-world complexity.
From Prompt to Precision: The Interactive Evolution of the Organization Chart
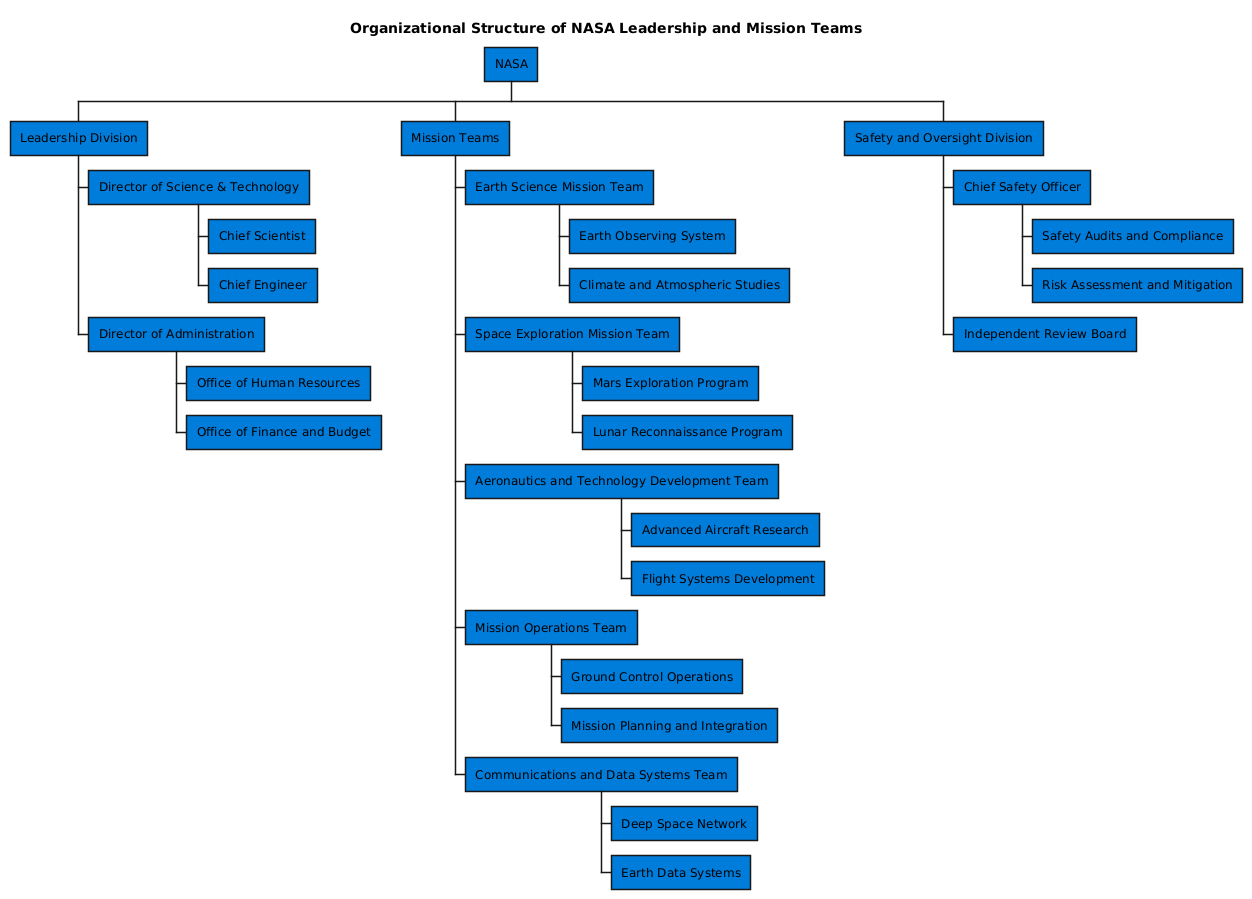
The journey began with a simple request: “Create an organization chart to visualize the leadership and mission teams of a space agency like NASA.” The AI responded instantly with a structured PlantUML WBS (Work Breakdown Structure) representation, laying out the core divisions: Leadership, Mission Teams, and Safety & Oversight.
But the real value emerged in the conversation. When the user asked, “Can you explain the role of the Chief Scientist within the Director of Science & Technology division?”, the AI didn’t just define the position—it contextualized it. It detailed the Chief Scientist’s influence on mission design, scientific policy, stakeholder engagement, and resource allocation, using real-world examples like the James Webb Space Telescope.
This wasn’t a static output. The AI adapted its response based on the user’s curiosity, turning a diagram into a living knowledge base. The user then requested refinements: “Refine the logic in the Earth Science Mission Team.” In response, the AI adjusted the hierarchy to better reflect the operational flow—grouping Earth Observing System and Climate and Atmospheric Studies under a unified scientific mission stream, ensuring clarity and alignment with NASA’s actual mission architecture.
Visualizing the Structure: A Model of Scientific and Operational Excellence
The final organization chart reflects a balance between strategic oversight and mission execution. It’s not just a list of roles—it’s a visual narrative of how science, engineering, and operations converge at the highest level of space exploration.
Decoding the Logic: Why This Structure Works
The diagram’s foundation lies in a hierarchical WBS (Work Breakdown Structure) format, which Visual Paradigm supports natively through its AI-powered PlantUML engine. This choice was deliberate:
- Top-down clarity: The NASA node sits at the apex, with leadership divisions branching downward, ensuring a clear chain of command and accountability.
- Functional grouping: Mission teams are grouped by domain—Earth Science, Space Exploration, Aeronautics, Operations, and Communications—mirroring how real agencies organize research and execution.
- Strategic oversight: The Safety and Oversight Division is positioned as a cross-cutting function, emphasizing its role in compliance, risk management, and independent review—critical for high-stakes missions.
- Role specificity: Each sub-node (e.g., Chief Scientist, Deep Space Network) represents a distinct responsibility, enabling stakeholders to quickly identify ownership and accountability.
By using PlantUML syntax with custom styling (e.g., deep blue background for leadership), the AI ensured the visual hierarchy reinforced the structural logic—making the diagram both accurate and aesthetically aligned with NASA’s brand identity.
Conversational Intelligence: Where the AI Adds Real Value
What sets Visual Paradigm apart is how the AI doesn’t just generate diagrams—it collaborates. When the user asked for an explanation of the Chief Scientist’s role, the AI didn’t stop at a definition. It provided:
- Strategic context (long-term vision)
- Operational impact (mission design, data standards)
- Real-world examples (James Webb Space Telescope)
- Decision-making influence (budget, resource allocation)
These insights weren’t added after the fact—they were part of the design process. The AI used the conversation to validate and refine the structure, ensuring that every node served a meaningful purpose.
And when the user requested a visual update, the AI responded with a revised PlantUML script that improved the flow and readability—proving that the chatbot is not just a generator, but a modeling consultant.
Beyond Organization Charts: A Full AI-Powered Modeling Suite
The Visual Paradigm AI Chatbot isn’t limited to organization charts. It supports a full suite of modeling standards, making it a complete solution for enterprise and IT architecture:
- UML: For software design, system behavior, and component modeling.
- ArchiMate: For enterprise architecture, aligning business, application, and technology layers.
- SysML: For systems engineering, including requirements, behavior, and parametric modeling.
- C4 Model: For software architecture visualization, from context to containers and components.
- Mind Maps, PERT Charts, SWOT, PEST, and Data Charts: For strategic planning, project scheduling, and data visualization.
This versatility means that once you start with an organization chart, you can seamlessly transition to modeling mission workflows (PERT), system architecture (C4), or even risk analysis (SWOT)—all within the same conversational environment.
Conclusion: The Future of Visual Modeling is Conversational
Creating an organization chart for a space agency like NASA is more than a diagramming task—it’s about capturing the soul of an institution. With the Visual Paradigm AI Chatbot, this becomes a collaborative, intelligent process where every question leads to deeper insight, and every refinement enhances clarity and impact.
Whether you’re designing leadership structures, mission teams, or system architectures, the platform empowers you to think visually, reason logically, and communicate effectively—all through natural conversation.
Ready to build your next model? Start your session now and experience the future of visual modeling.