

Designing a Smart Energy Grid with AI-Powered Precision
Modeling a modern smart energy grid demands more than static diagrams—it requires a dynamic, intelligent approach to capture complex interactions between generation, storage, distribution, monitoring, and consumption. The challenge lies not just in visualizing components, but in expressing how they collaborate in real time, especially with increasing reliance on renewable sources and digital control systems.
Enter the Visual Paradigm AI Chatbot—a conversational modeling expert that transforms high-level ideas into structured, standards-compliant SysML Block Definition Diagrams. Instead of starting from scratch or wrestling with syntax, users simply describe their intent in natural language. The AI interprets, refines, and delivers a fully functional diagram—complete with accurate semantics and relationships.
From Idea to Diagram: A Collaborative Design Journey
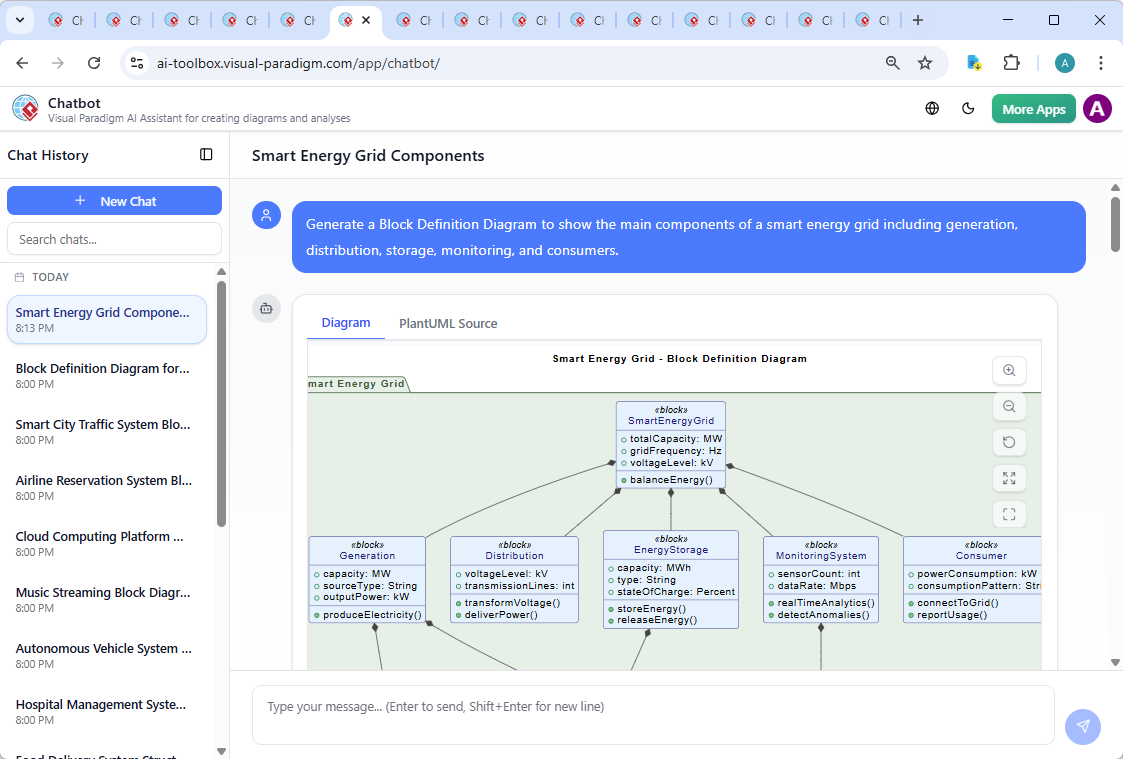
The process began with a simple prompt: “Generate a Block Definition Diagram to show the main components of a smart energy grid including generation, distribution, storage, monitoring, and consumers.”
Within seconds, the AI delivered a fully rendered PlantUML-based BDD, already structured with proper blocks, attributes, operations, and relationships. But the conversation didn’t stop there.
When the user asked, “Explain this diagram”, the AI responded not just with a summary—but with a layered breakdown that clarified each component’s role, its relationships, and the system-level implications. It didn’t just describe the diagram; it contextualized it, explaining how the Grid Controller acts as the central decision-maker, how Energy Storage supports demand balancing, and why Smart Meters are critical for real-time feedback.
This exchange exemplifies the AI Chatbot’s deeper intelligence: it doesn’t just generate diagrams—it explains, justifies, and evolves the model through dialogue. When the user later requested refinements like “AI, refine the logic” or “Explain this branch”, the chatbot adjusted the structure, clarified dependencies, and even suggested enhancements such as adding load forecasting or geographic distribution.
Decoding the Smart Energy Grid Block Definition Diagram
The resulting Block Definition Diagram is a foundational model for systems engineering, built on the principles of SysML to represent the static structure of the smart grid. Here’s a detailed breakdown of its logic and design choices:
Core Components & Their Roles
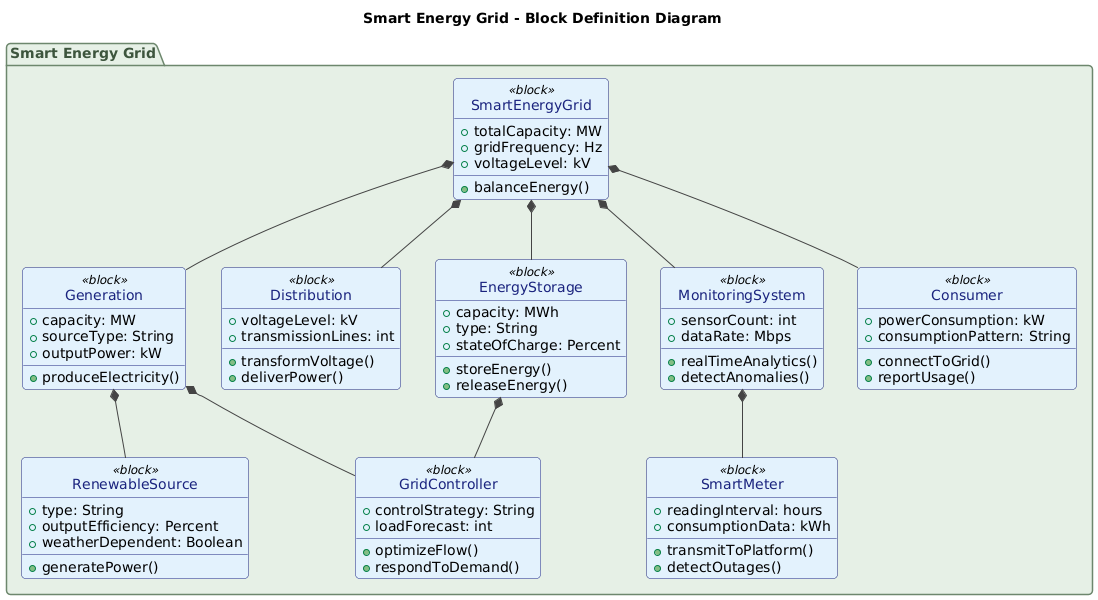
- Smart Energy Grid: The top-level container, representing the entire system. It aggregates all components and ensures coherence across functions.
- Generation: The source of power, with a clear link to Renewable Source to highlight sustainability and intermittency challenges.
- Distribution: Handles voltage transformation and delivery—critical for maintaining grid stability.
- Energy Storage: Acts as a buffer. Its state-of-charge and dynamic control make it essential for handling fluctuations from renewables.
- Monitoring System: Provides real-time data via sensors and enables anomaly detection—key for reliability and cybersecurity.
- Consumer: Represents end users, with variable demand patterns and integration via smart meters.
- Grid Controller: The intelligent core. It uses load forecasts and real-time data to optimize energy flow—making it the central orchestrator.
- Smart Meter: Enables two-way communication, supporting demand response and outage detection.
Why Block Definition Diagrams?
Unlike traditional diagrams that focus on behavior or sequence, a Block Definition Diagram excels at modeling the static architecture of complex systems. It’s ideal for smart grids because:
- It clearly defines what components exist and how they are structured.
- It supports composition (e.g., Grid Controller managing Energy Storage) and association (e.g., Monitoring System linking to Smart Meters).
- It enables later modeling of internal structure (via Internal Block Diagrams), behavior (Sequence Diagrams), and requirements.
By using SysML’s block-based modeling, the diagram becomes a living blueprint—ready for simulation, validation, and integration into larger system design workflows.
The AI Chatbot in Action: Conversational Intelligence at Work
What sets Visual Paradigm apart is not just the diagram output—but the interactive intelligence behind it. The AI doesn’t just respond to commands; it engages in a dialogue that deepens understanding and improves design.
For example, when the user asked for an explanation, the AI didn’t just list components. It provided:
- Functional roles (e.g., Grid Controller as the decision engine).
- System-level benefits (resilience, scalability, data-driven operation).
- Practical use cases (project planning, stakeholder communication, education).
This level of contextual insight is the hallmark of an AI-powered modeling assistant—not a tool, but a collaborative expert.
More Than Just SysML: A Unified Modeling Platform
While this example focused on SysML Block Definition Diagrams, the Visual Paradigm AI Chatbot is not limited to one standard. It seamlessly supports:
- UML: For software and system design.
- ArchiMate: For enterprise architecture, showing business, application, and technology layers.
- C4 Model: For software architecture, with Context, Containers, Components, and Code views.
- Mind Maps, Org Charts, PEST, SWOT: For strategic planning and brainstorming.
- Charts (column, pie, line, area): For data visualization and reporting.
Whether you’re modeling a smart grid, designing a banking system, or mapping organizational strategy, the AI Chatbot adapts to your domain—delivering accurate, professional diagrams across standards.
Conclusion: The Future of System Design Is Conversational
Creating a smart energy grid model is no longer about mastering syntax or memorizing notation. With Visual Paradigm’s AI Chatbot, it’s about conversing with a modeling expert who understands your vision and helps you build it with precision.
From the initial prompt to the final explanation, every step was guided by intelligent collaboration—proving that the future of visual modeling isn’t just automated, but conversational, adaptive, and deeply insightful.
Ready to design your next system? Explore the live session and experience how the AI Chatbot turns ideas into structured, professional models—crafted using the Visual Paradigm AI Chatbot.