

Designing a Smart Home Ecosystem: From Idea to Precision Model
Creating a clear, scalable architecture for a smart home system demands more than just visual clarity—it requires precision in component relationships, data flow, and system boundaries. The challenge lies in translating abstract concepts like automation, synchronization, and remote control into a structured, standardized diagram that stakeholders across development, operations, and product teams can understand.
Enter the Visual Paradigm AI Chatbot. This isn’t just a diagram generator. It’s a collaborative modeling partner that transforms natural language prompts into detailed, standards-compliant visual models—complete with intelligent feedback, iterative refinement, and cross-layer insights. In this journey, we’ll walk through how the AI evolved a simple request into a fully fleshed-out Component Diagram for a smart home system, guided by real-time conversation and expert-level design logic.
From Prompt to Precision: A Collaborative Modeling Journey
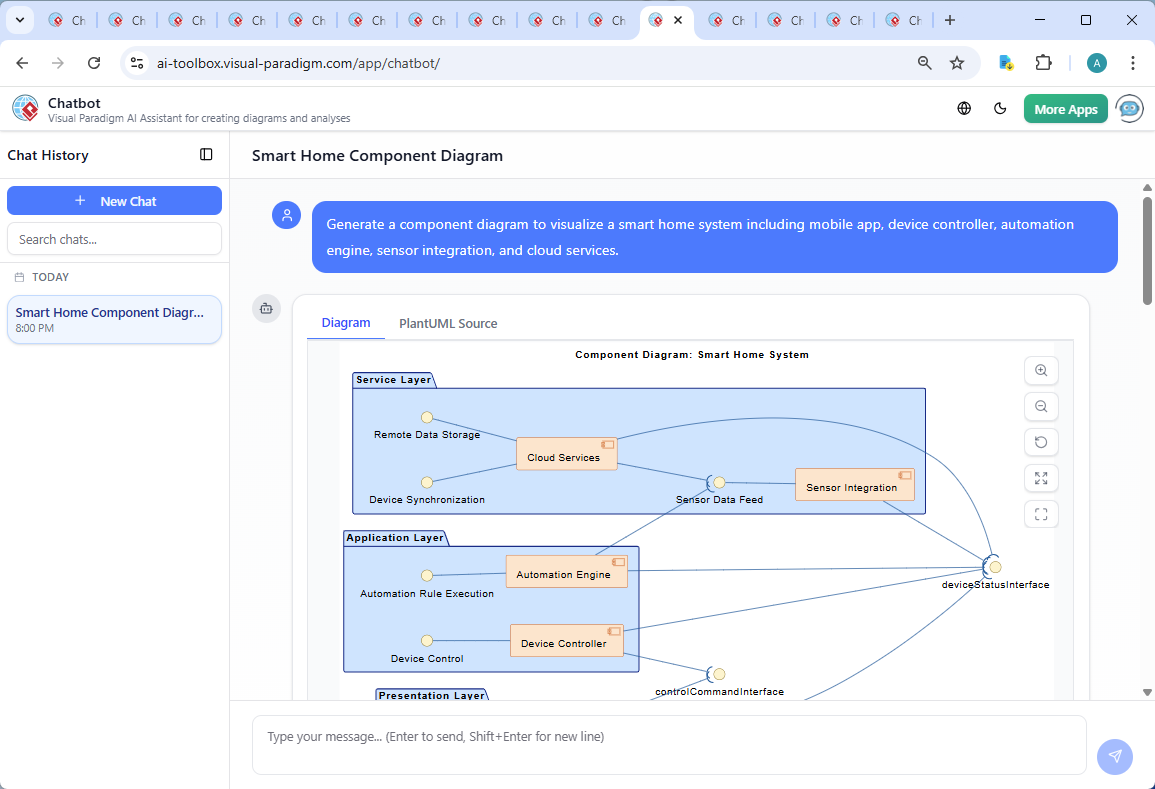
It began with a straightforward request: “Generate a component diagram to visualize a smart home system including mobile app, device controller, automation engine, sensor integration, and cloud services.”
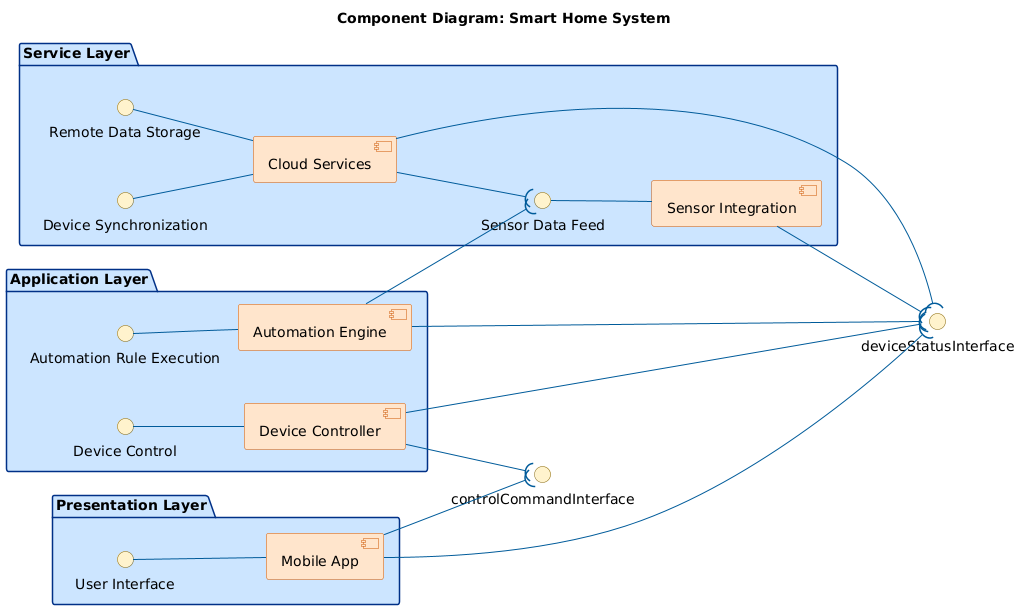
Within seconds, the Visual Paradigm AI Chatbot delivered a fully rendered PlantUML-based component diagram, structured with layered packages and labeled interfaces. The system was immediately organized into three logical layers: Presentation Layer, Application Layer, and Service Layer, each housing components and their interface contracts.
But the real value emerged in the conversation that followed. When the user asked, “What specific data does the Device Controller send to the Cloud Services for synchronization?”, the AI didn’t just provide a list—it responded with a structured breakdown of five data categories, each tied to a functional purpose:
- Device Status Updates – Real-time state tracking
- Device Configuration Settings – User-defined preferences
- Event Triggers and Alerts – Automation triggers
- User Interaction Logs – Action history for analytics
- Health and Diagnostic Information – Maintenance and monitoring
Even better, the AI offered to visualize this data flow as a follow-up. This level of responsiveness—where the chatbot acts as a design consultant, not just a tool—highlights the platform’s intelligence. It doesn’t stop at diagramming; it deepens understanding through explanation, context, and refinement.
Decoding the Logic: Why This Component Diagram Works
The diagram’s structure is rooted in architectural best practices. Each component is a self-contained unit with defined responsibilities, and interfaces represent the contracts through which components interact—ensuring loose coupling and clear boundaries.
Here’s how the layers map to real-world functionality:
Presentation Layer: The User Experience
The Mobile App serves as the primary interface. It communicates via the User Interface interface to receive inputs and display device states. The app sends control commands and receives status updates—making it the user-facing entry point.
Application Layer: Core Intelligence
The Device Controller manages direct communication with physical devices. It receives commands from the mobile app and relays them to the hardware, while also reporting back status. The Automation Engine uses sensor data and rules to trigger actions—like turning on lights when motion is detected—making it the brain of the system.
Service Layer: Scalability and Persistence
The Cloud Services component is the central hub for remote access, data storage, and synchronization. It receives device status, configuration, and event data from the Device Controller and Sensor Integration. In turn, it sends updates back to ensure consistency across all user devices—whether at home or on the go.
The Sensor Integration layer acts as a bridge between physical sensors (like PIR motion detectors or temperature sensors) and the rest of the system. It processes raw sensor data and forwards it to the Automation Engine and Cloud Services.
By using interfaces to define interactions (e.g., Device Control, Automation Rule Execution, Remote Data Storage), the diagram ensures that components don’t depend on implementation details—only on contract-based communication. This is a hallmark of robust, maintainable systems.
Conversational Intelligence: The AI as a Modeling Partner
What sets Visual Paradigm apart is how the AI Chatbot functions as a real-time collaborator. The conversation wasn’t a one-way request-response—it was a dialogue where each follow-up refined the model’s depth and accuracy.
When the user asked for clarification on data synchronization, the AI didn’t just list fields. It provided:
- Specific data examples (e.g., JSON payloads)
- Functional purposes for each data type
- A concise summary table for quick reference
- An invitation to generate a follow-up diagram
This kind of contextual intelligence—where the AI anticipates next steps and offers actionable next moves—transforms the experience from diagram creation to architectural co-design.
Beyond Component Diagrams: A Full Modeling Suite
The Visual Paradigm AI Chatbot isn’t limited to component diagrams. It supports a full spectrum of modeling standards, making it a unified platform for enterprise and software architects:
- UML – For detailed system behavior and structure, including Sequence Diagrams and Class Diagrams
- ArchiMate – For enterprise architecture, aligning business, application, and technology layers
- SysML – For complex systems engineering and requirements modeling, including Requirement Diagrams, Block Definition Diagrams, and the Advanced SysML Diagram
- C4 Model – For clear, scalable software architecture visualization (context, containers, components, code)
- Mind Maps, PERT Charts, Org Charts, SWOT, PEST, and Data Charts – For strategic planning, project management, and stakeholder communication
Whether you’re designing a smart home system, a banking backend, or a cloud-native microservices architecture, the AI Chatbot adapts to your domain and modeling needs—delivering precision with minimal input.
Conclusion: Design Smarter, Faster, Together
Visual Paradigm’s AI Chatbot turns abstract ideas into actionable, standardized models through natural conversation. It doesn’t just generate diagrams—it guides, explains, refines, and extends the design process in real time.
From the initial prompt to the data flow breakdown, every step reflects a deeper understanding of system architecture. The result? A smart home system that’s not only visually clear but also technically sound, scalable, and ready for implementation.
Ready to model your next system with AI-powered precision? Try the Smart Home System example in the Visual Paradigm AI Chatbot—and experience the future of visual modeling.
Related Links
- Component Diagram – Wikipedia: A UML diagram that illustrates the organization and dependencies of components in a software system.
- What is a Component Diagram? – Visual Paradigm: A detailed guide on UML component diagrams, showing how components interact and are structured in software design.
- Component Diagram Tutorial: Component Diagram Tutorial. Component diagrams provide a simplified, high-order view of a large system. Classifying groups of classes into components supports the interchangeability…