

Designing a Scalable CRM System: How AI Transforms Concept into Precision Architecture
Building a robust Customer Relationship Management (CRM) system demands more than just assembling components — it requires a clear understanding of how each module interacts, where data flows, and how consistency is maintained across teams. The challenge lies in translating business requirements into a structured, maintainable architecture that supports scalability, integration, and real-time decision-making.
With Visual Paradigm’s AI Chatbot, this process becomes a dynamic collaboration. Instead of starting from scratch or wrestling with syntax, users can articulate their vision in natural language — and watch the AI generate a precise, standards-compliant component diagram in real time. This isn’t automated diagramming; it’s intelligent architectural co-design.
From Idea to Diagram: A Conversational Design Journey
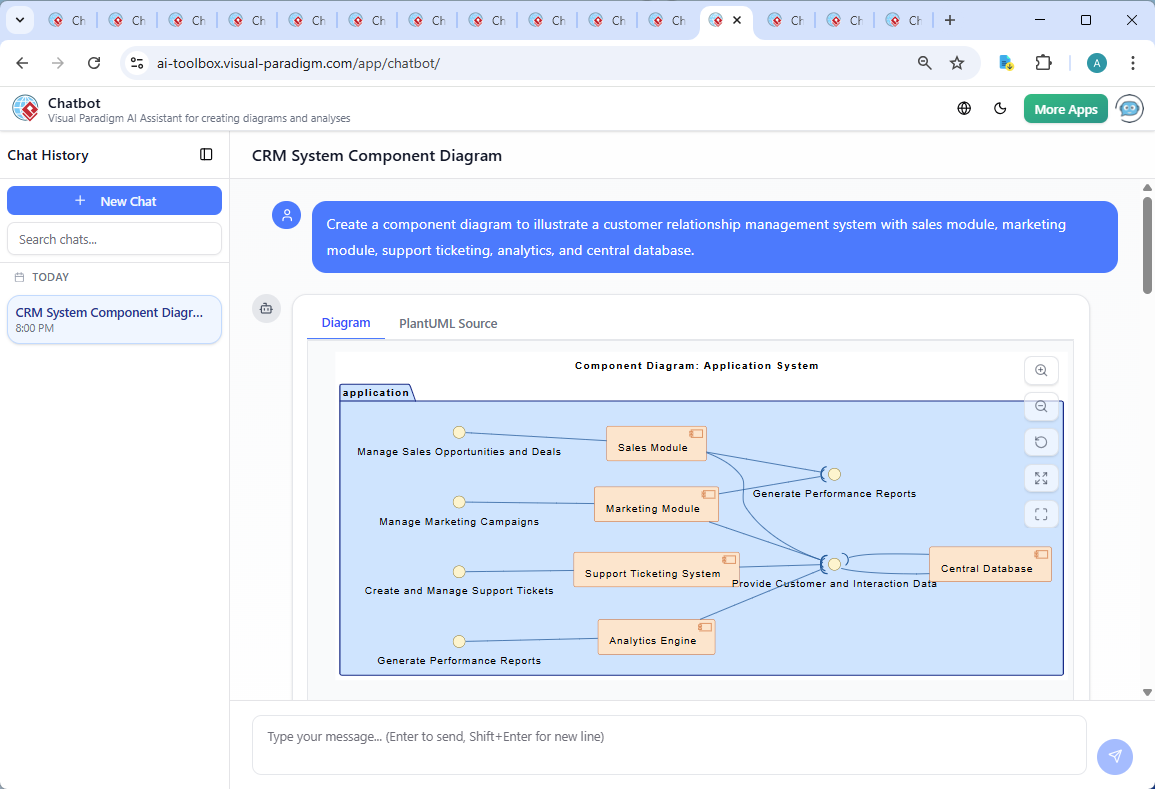
The journey began with a simple prompt: “Create a component diagram to illustrate a customer relationship management system with sales module, marketing module, support ticketing, analytics, and central database.”
Within seconds, the Visual Paradigm AI Chatbot delivered a fully rendered PlantUML script, complete with proper component boundaries, interfaces, and layout logic. The diagram wasn’t just visually clean — it was semantically accurate, reflecting real-world software architecture principles.
But the true value emerged in the follow-up. When the user asked, “Can you explain how the Sales Module interacts with the Central Database through the customerDataInterface?”, the AI didn’t just restate the diagram. It provided a structured, business-aware explanation — breaking down read/write operations, synchronization patterns, and data integrity implications.
Further refinement followed: “AI, refine the logic to show asynchronous updates.” The chatbot responded by enhancing the interaction semantics, clarifying that data updates are event-driven, not synchronous — a subtle but critical detail for system performance and scalability.
Each exchange wasn’t a static response — it was a modeling conversation. The AI acted as a senior architect, guiding the user through design trade-offs, interface responsibilities, and cross-module dependencies.
Decoding the Component Diagram Logic
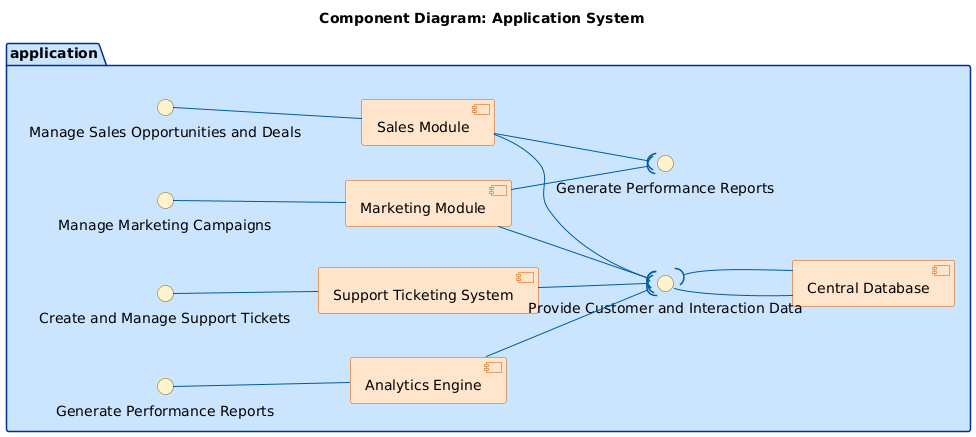
The generated component diagram reflects a well-structured CRM architecture, where each module is encapsulated with a clear responsibility and defined interface. Let’s walk through the core logic:
Core Components and Their Roles
- Sales Module: Manages opportunities, deals, and sales pipelines. It reads customer data and writes updated deal statuses.
- Marketing Module: Handles campaign tracking, lead nurturing, and segmentation. It uses the same customer data for targeting.
- Support Ticketing System: Tracks customer issues, assigns tickets, and logs interactions. All data is sourced from the central repository.
- Analytics Engine: Consumes transactional and behavioral data to generate performance reports and forecasts.
- Central Database: Acts as the single source of truth, storing customer profiles, interactions, and business events.
Interface-Driven Communication
Instead of direct component-to-component links, all interactions flow through well-defined interfaces:
customerDataInterface: Serves as the unified data gateway for all modules. This ensures loose coupling and enables future scalability (e.g., replacing the database backend without affecting modules).analyticsReportingInterface: Allows the Analytics Engine to pull insights without direct access to the raw data — promoting data governance.ticketManagementInterface: Defines the contract for support ticket creation and status updates.
By using interfaces, the design supports:
- Modular development and independent deployment
- Testability and mocking during development
- Future extensibility (e.g., adding AI-driven lead scoring via a new module)
Why Component Diagrams?
Component diagrams are ideal for CRM systems because they visualize:
- High-level system structure
- Inter-module dependencies and data flow
- Boundary definition between business logic and data storage
This clarity is critical for stakeholders — from developers to product managers — to align on system boundaries and integration points.
Conversational Intelligence in Action
What sets Visual Paradigm apart isn’t just the diagram output — it’s the depth of insight the AI provides during the design process. The chat history shows how the AI evolved from a diagram generator to a modeling consultant:
- After the initial diagram, the user asked for clarification on a specific interaction.
- The AI responded with a layered explanation — covering data flow, operational semantics, and business impact.
- When asked to refine the logic, the AI updated the design to reflect asynchronous, event-driven behavior — a more realistic and scalable pattern.
This level of contextual understanding is not typical of generic AI tools. Visual Paradigm’s AI Chatbot is trained on architectural best practices, UML semantics, and real-world enterprise systems.
More Than Just Component Diagrams: A Full Modeling Suite
While this example focused on a Component Diagram, the Visual Paradigm AI Chatbot is built to support a full spectrum of modeling standards — making it a true AI-powered visual modeling platform.
It seamlessly handles:
- UML: Class, sequence, activity, and state diagrams for detailed system design. ArchiMate: For enterprise architecture, modeling business, application, and technology layers.
- SysML: For systems engineering, including requirements, block definition, and internal block diagrams.
- C4 Model: For software architecture documentation, visualizing context, containers, components, and code.
- Non-Functional Diagrams: Mind maps, PERT charts, org charts, SWOT, PEST, and various data visualization types (pie, line, area, column).
Whether you’re designing a healthcare management system, a financial trading platform, or a cloud-native microservices architecture, the AI Chatbot adapts to your modeling needs — guiding you through every step with expert-level insight.
Conclusion: Design Smarter, Not Harder
Visual Paradigm’s AI Chatbot transforms the way teams approach system design. Instead of spending hours drafting diagrams or debating notation, users can focus on strategy, business logic, and innovation — while the AI handles the technical precision.
For any organization building complex systems, especially in regulated domains like healthcare or finance, having a collaborative, intelligent modeling partner is no longer a luxury — it’s essential.
Explore how the Visual Paradigm AI Chatbot can bring your next system design to life — start your session today.
Related Links
- Component Diagram – Wikipedia: A UML diagram that illustrates the organization and dependencies of components in a software system.
- What is a Component Diagram? – Visual Paradigm: A detailed guide on UML component diagrams, showing how components interact and are structured in software design.
- Component Diagram Tutorial: Component Diagram Tutorial. Component diagrams provide a simplified, high-order view of a large system. Classifying groups of classes into components supports the interchangeability…