

Data Flow Diagram
A Data Flow Diagram maps out the path of your data, showing the steps it takes and the people or departments that handle it along the way.
Instant Data Flow Diagram Creation
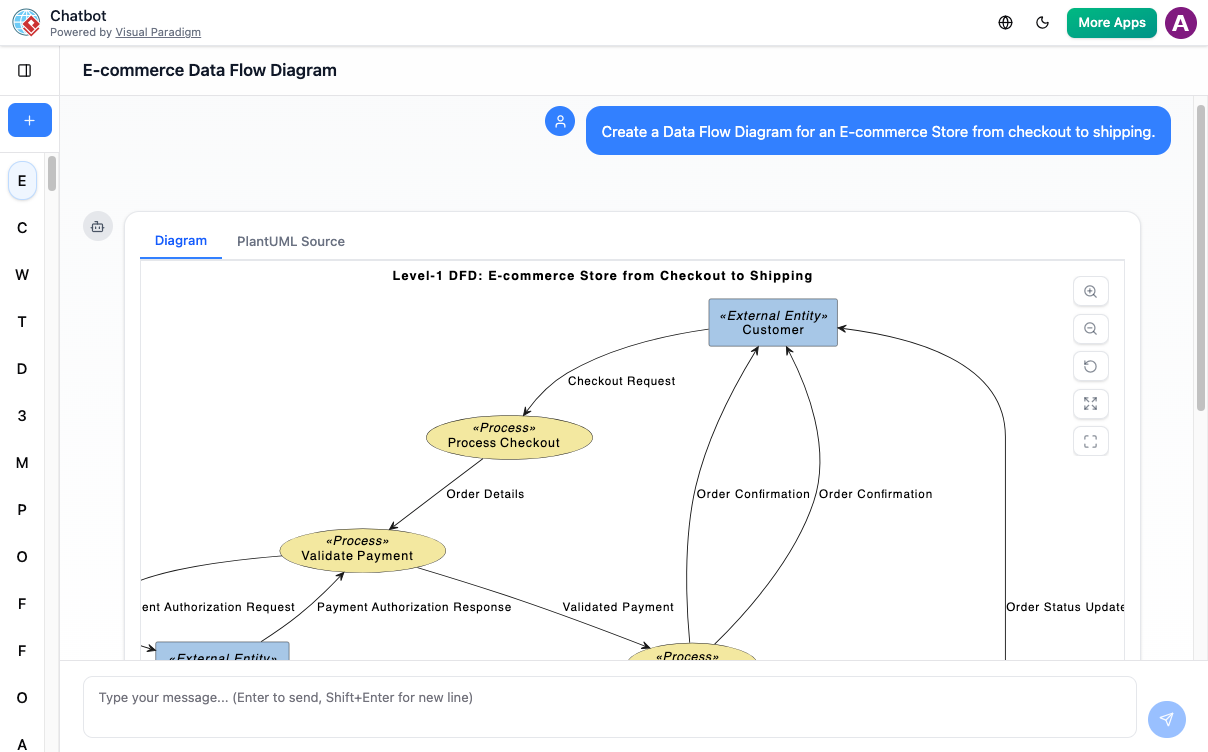
With the AI chatbot, mapping out your information becomes much easier. Instead of manually drawing arrows, boxes, and storage folders, you can simply describe how your data moves in plain language.
The chatbot converts your explanation into a clear Data Flow Diagram that highlights how information is processed, where it’s saved, and who receives it. Whether you are mapping out a simple customer order or a complex company-wide reporting system, the AI quickly generates a clean visual map of your data’s journey.
Refine the Flow Through Conversation
Data systems are rarely perfect on the first try, so the AI lets you “stress-test” your logic through chat. You can ask the AI to:
Add a new checkpoint: “What happens if the credit card is declined?”
Trace a path: “Show me exactly how the customer’s address gets to the shipping label.”
Identify gaps: “Is there any step where we’re losing information?”
The diagram updates instantly, allowing you to move “data bubbles” and “storage files” around until the logic is seamless. This conversational approach helps you find bottlenecks, eliminate redundant steps, and ensure that every piece of information in your system has a clear purpose and a safe place to go.

Benefits of Creating Data Flow Diagrams with the AI Chatbot
Automatically applies correct DFD notation for processes, data stores, external entities, and data flows.
Instantly maps the path of information from entry point to final storage.
Validates data persistence to ensure every piece of information has a destination.
Organizes complex systems into nested levels of detail (Level 0 to Level 1).
Maintains consistency between data inputs and outputs across the entire diagram.
Identifies bottlenecks and redundant steps in the information lifecycle.
Examples of Generating Data Flow Diagram
Use simple text prompts to generate this diagram in seconds. Here are a few examples to get you started:
Food Delivery App
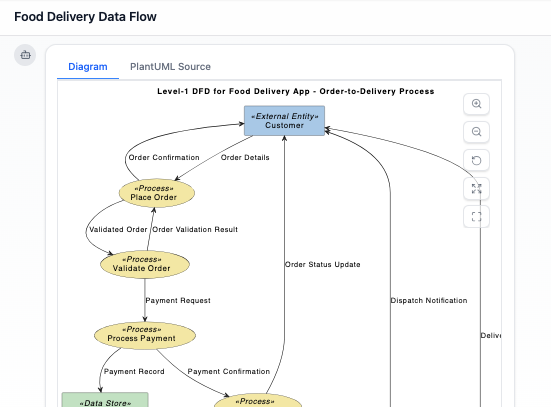
“Generate a Data Flow Diagram for a Food Delivery App showing the order-to-delivery process.”
Social Media Platform
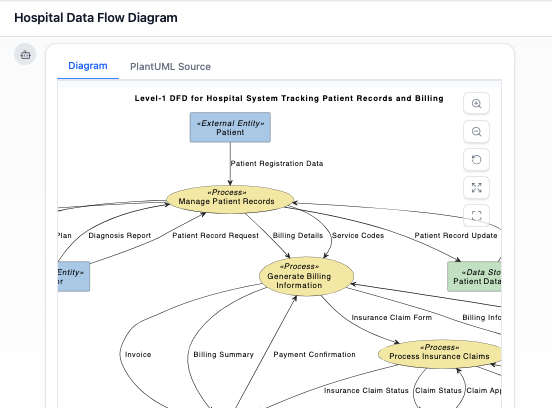
“Create a Data Flow Diagram for a Hospital System tracking patient records and billing.”
Hospital Management System
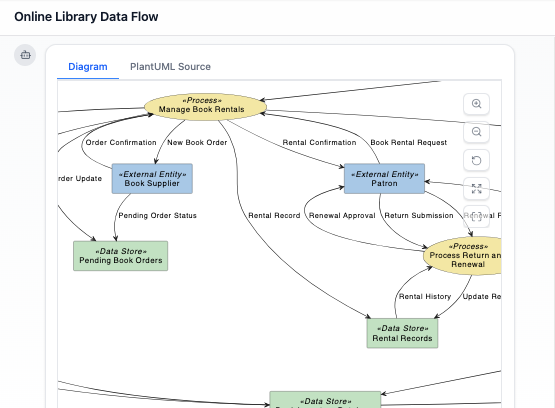
“Generate a Data Flow Diagram for an Online Library mapping book rentals and inventory updates.”
What Is a Data Flow Diagram?
A Data Flow Diagram (DFD) is a visual map that shows how information moves through a system. Unlike other diagrams that focus on how software is built or organized, a DFD focuses on the journey of data. It highlights where information comes from, who interacts with it, how it changes, and where it is eventually stored.
The 4 Simple Elements of Your Data Map:
External Entities (The Sources): These are the “people or things” outside the system that provide or receive information.
Examples: A customer, a bank, or a manager.
Processes (The Actions): These are the “work circles” where something happens to the data.
Examples: Calculating a total, verifying a password, or printing a receipt.
Data Stores (The Files): These represent where information sits when it’s not moving.
Examples: A digital database, a spreadsheet, or a physical filing cabinet.
Data Flows (The Paths): These are the arrows that show exactly which direction the information is traveling between the other three elements.
Key Concepts
External Entities
These are the “outside” players—like customers, managers, or even other companies—that send information into your system or receive a final result from it. They define the boundaries of your map.
Processes
A process is any action that changes incoming data into an outgoing result. Think of these as the “work” being done, such as calculating a tax, verifying a password, or sorting a list of names.
Data Stores
Data stores are where information sits when it isn’t currently moving. This could be a digital database, a cloud folder, or even a physical file cabinet. It represents “data at rest.”
Data Flows
Represented by arrows, these show the specific “packets” of information traveling between entities, processes, and stores. They ensure you can track exactly how a piece of data gets from point A to point B.
Levels of Decomposition
DFDs use “Levels” to manage complexity. A Level 0 (Context Diagram) shows the entire system as one single bubble, while a Level 1 or Level 2 “zooms in” to show the smaller, detailed steps inside that bubble.
Balancing
This concept ensures that when you “zoom in” to a more detailed level, the information entering and leaving that section stays the same. It prevents “magic” data from appearing out of nowhere or disappearing without a trace.
Conservation of Data
Information doesn’t just happen; it must be created by a process. This rule states that data cannot move directly from one “storage bin” to another or from one “outside person” to another without a Process in the middle to handle the move.
Ready to Revolutionize Your Workflow with AI?
Stop wrestling with tools. Embrace AI-powered visual modeling. Let our AI handle the visualization so you can focus on solving the bigger problems.