


Chen ERD Diagram
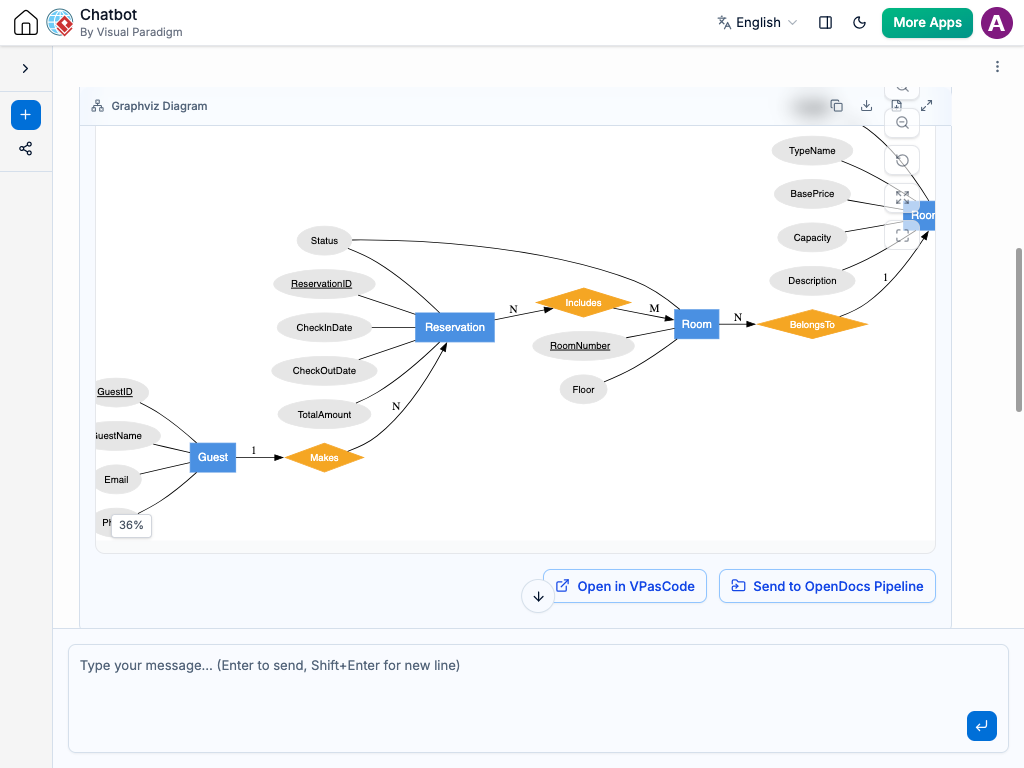
Instant Chen ERD Creation
With the AI chatbot, designing your database structure becomes much easier. Instead of manually dragging diamonds, rectangles, and ovals onto a canvas, you can simply describe your data relationships in plain language.
The chatbot converts your explanation into a clear Chen Entity-Relationship Diagram that highlights how entities connect and what characteristics they hold. Whether you are modeling a simple online store layout or a complex company-wide database system, the AI quickly generates a clean visual map of your data architecture.
Refine the Relationships Through Conversation
Database designs are rarely perfect on the first try, so the AI lets you “stress-test” your schema through chat. You can ask the AI to:
Add a new relationship: “What if a customer can place multiple orders, but each order belongs to only one customer?”
Detail your entities: “Add an email address and a phone number to the User entity.”
Identify structural issues: “Check if I have any missing links or many-to-many relationships that need a junction table.”
The diagram updates instantly, allowing you to move your data shapes around until the logic is seamless. This conversational approach helps you find bottlenecks, eliminate redundant attributes, and ensure that every piece of database information has a clear purpose and a structured place to live.


Automatic Chen Notation: Automatically applies correct Chen ERD notation for entities, relationships, attributes, and key constraints.
Instant Cardinality Mapping: Instantly maps the relationships between tables, explicitly defining 1:1, 1:N, or M:N connections.
Schema Validation: Validates database integrity to ensure every relationship connects valid entities without orphaned shapes.
Multi-Value Handling: Properly identifies and displays complex data traits like multi-valued or derived attributes.
Logical Consistency: Maintains consistency between primary keys and foreign relationships across the entire diagram.
Structural Optimization: Identifies structural redundancies and helps normalize your data fields before you write any SQL.
Examples of Generating Chen ERDs
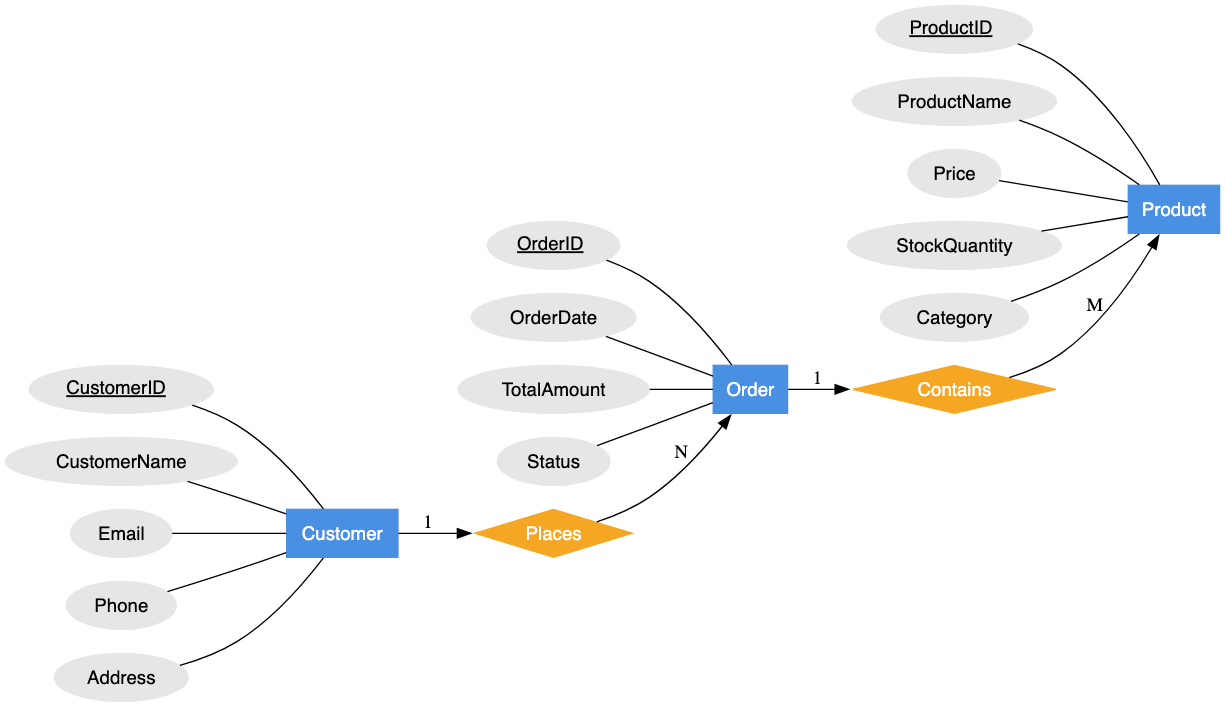
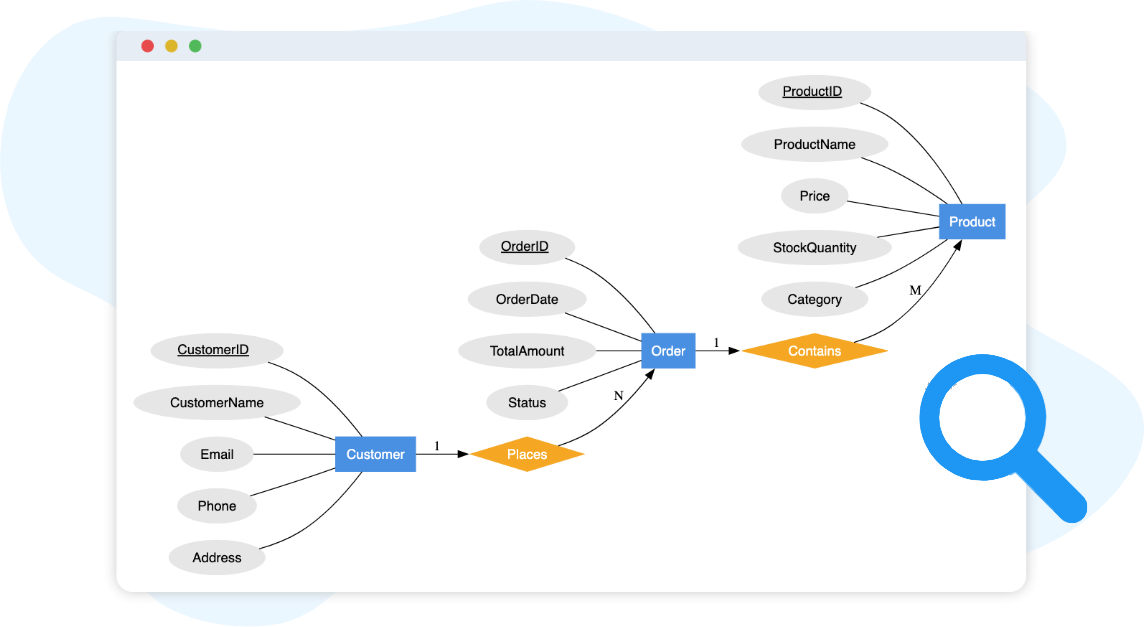
“Generate a Chen ERD for an E-Commerce Store showing Customers, Orders, and Products with their relationships.”
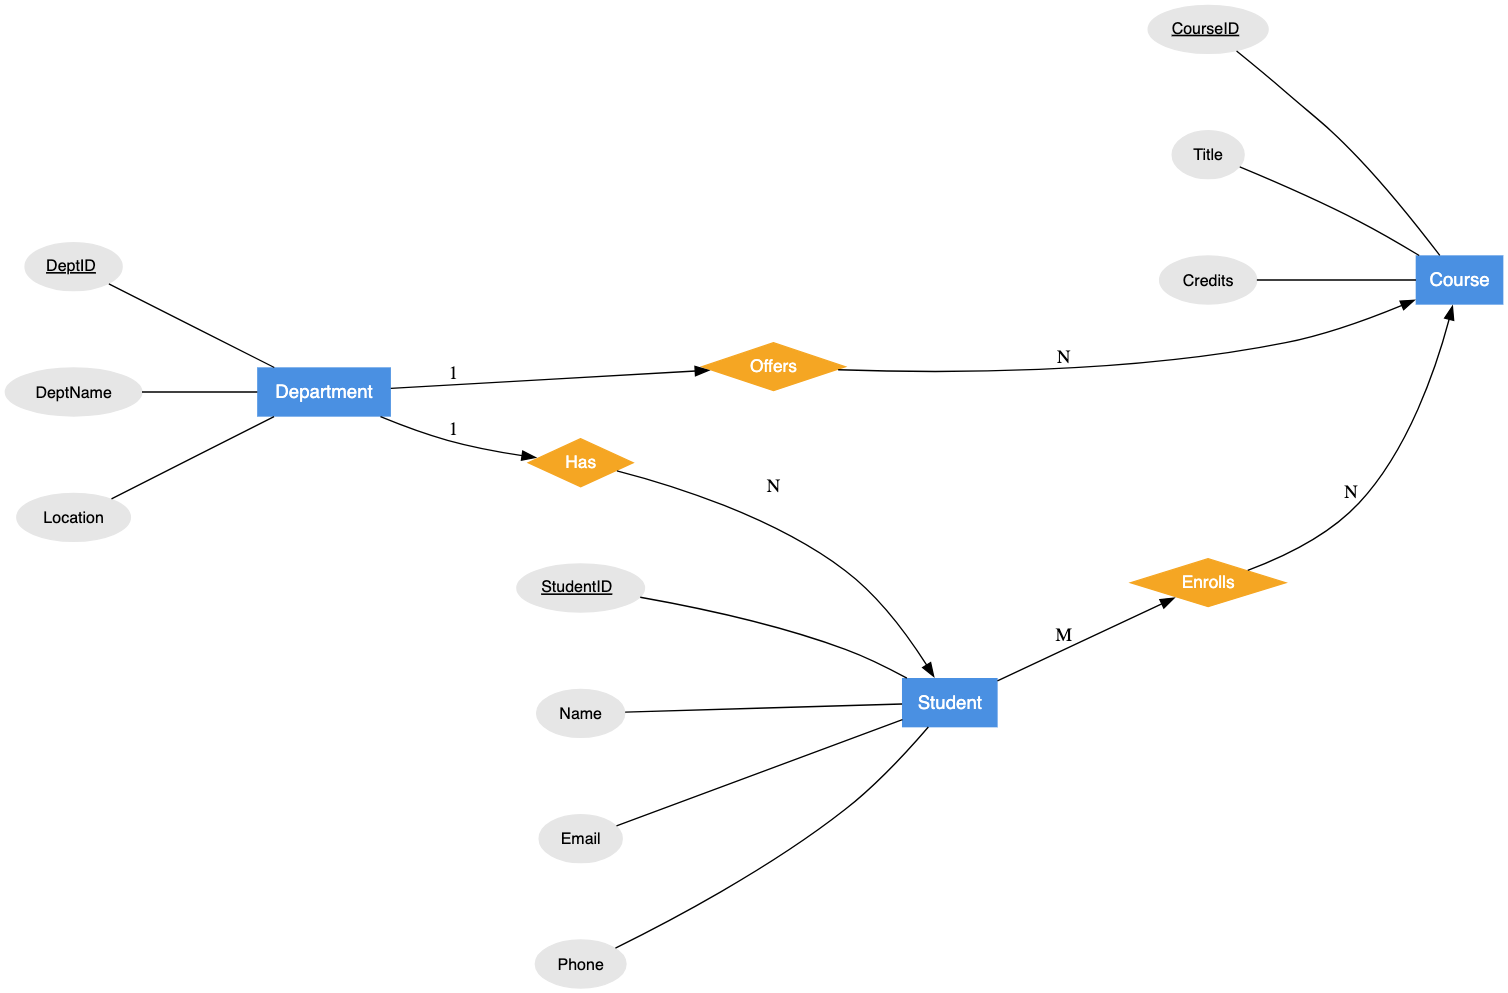
“Create a Chen ERD for a School System tracking Students, Courses, and Departments.”
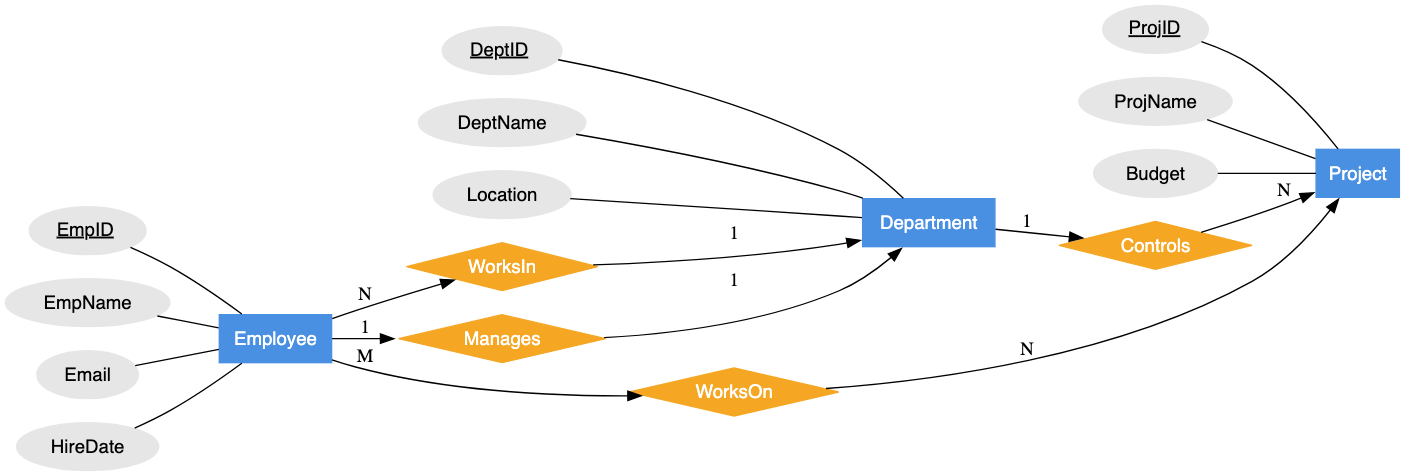
“Generate a Chen ERD for a Company mapping Employees, Projects, and Departments.”
What Is a Chen ERD?
A Chen Entity-Relationship Diagram (ERD) is a visual map that shows how data tables relate to one another within a database. Unlike other technical schemas that focus heavily on code tables and data types, a Chen ERD focuses on the conceptual logic of your business data. It highlights what the real-world objects are, how they interact, and what descriptive traits they possess.
The 4 Simple Elements of Your Database Map:
Entities (The Objects): These are the “people, places, or things” you want to store data about. They are drawn as Rectangles.
Examples: Customer, Product, or Employee.
Relationships (The Links): These are the “action verbs” showing how two entities interact. They are drawn as Diamonds.
Examples: Places (Customer places Order), Contains (Order contains Product).
Attributes (The Details): These are the specific characteristics or properties of an entity. They are drawn as Ovals.
Examples: Name, Price, or Birthdate.
Lines (The Connections): These link attributes to entities and entities to relationships, often showing numbers or letters (1, N, M) to define the relationship rules.
Key Concepts
Entities
Relationships
Attributes
Cardinality
This concept defines the numerical rules of a relationship. It specifies whether an entity links to exactly one other item (1:1), many items (1:N), or if multiple items link to multiple others (M:N).