UML Deployment Diagram

The UML Deployment Diagram displays the physical architecture of a system, mapping software artifacts onto hardware nodes.

Generate UML Deployment Diagram with AI Chatbot.

Instant Deployment Diagram Generation

With the AI chatbot, turning your infrastructure ideas into a visual deployment map becomes incredibly fast. Simply describe your environment—physical servers, cloud instances, containers, or network links—and the chatbot will convert your text into a structured UML Deployment Diagram. Whether you mention a three-tier architecture or a simple client–server setup, the AI instantly places nodes, artifacts, and communication paths in the correct positions, giving you a clear snapshot of how everything fits together.

The AI Chatbot can generate different diagrams according to your need in the chat.

Refine Your Infrastructure Through Conversation

Once the initial diagram is created, you can keep refining it by chatting naturally with the AI. Ask to add containers inside servers, relocate artifacts, introduce new network protocols, or compare layout alternatives. The diagram updates immediately, allowing you to experiment with different architectures without redrawing anything manually. This conversational workflow helps you explore ideas, validate assumptions, and adjust to new requirements with minimal effort.

Benefits of Creating Deployment Diagrams with the AI Chatbot

tick-icon-3.png

Quickly transforms written descriptions into accurate deployment topologies.

tick-icon-3.png

Automatically applies UML standards for nodes, artifacts, environments, and connections.

tick-icon-3.png

Makes it easy to adjust infrastructure by issuing simple text commands.

tick-icon-3.png

Supports cloud, hybrid, and containerized architectures with consistent clarity.

tick-icon-3.png

Helps teams visualize network paths and dependencies for better decision-making.

tick-icon-3.png

Ensures diagrams stay current as environments evolve.

tick-icon-3.png

Reduces time spent manually arranging or formatting complex layouts.

Examples of Generating UML Deployment Diagram

Use simple text prompts to generate this diagram in seconds. Here are a few examples to get you started:

Warehouse Inventory Management System

UML Deployment Diagram examples of Warehouse Inventory Management System

“Draw a Deployment Diagram for a Warehouse Inventory Management System.”

Point-of-Sale (POS) System

UML Deployment Diagram examples of Point-of-Sale (POS) System

“Prepare a Deployment Diagram for a Point-of-Sale (POS) System.”

Insurance Claim Processing System

Insurance Claim Processing System

“Prepare a Deployment Diagram for an Insurance Claim Processing System.”

What Is a UML Deployment Diagram?

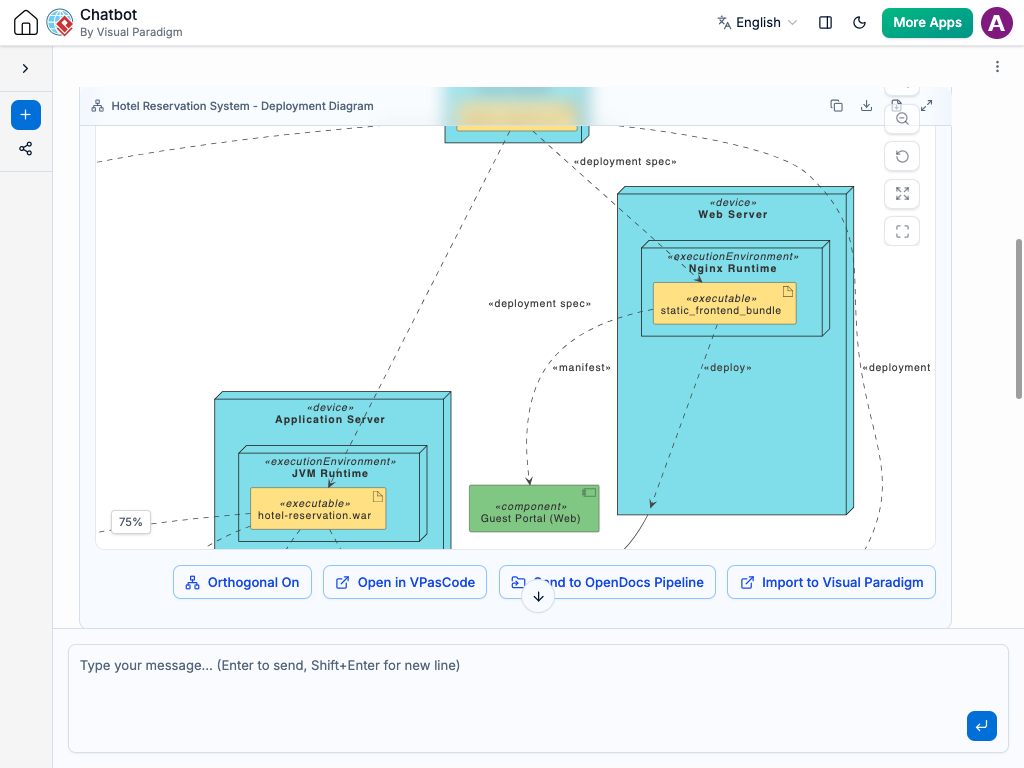
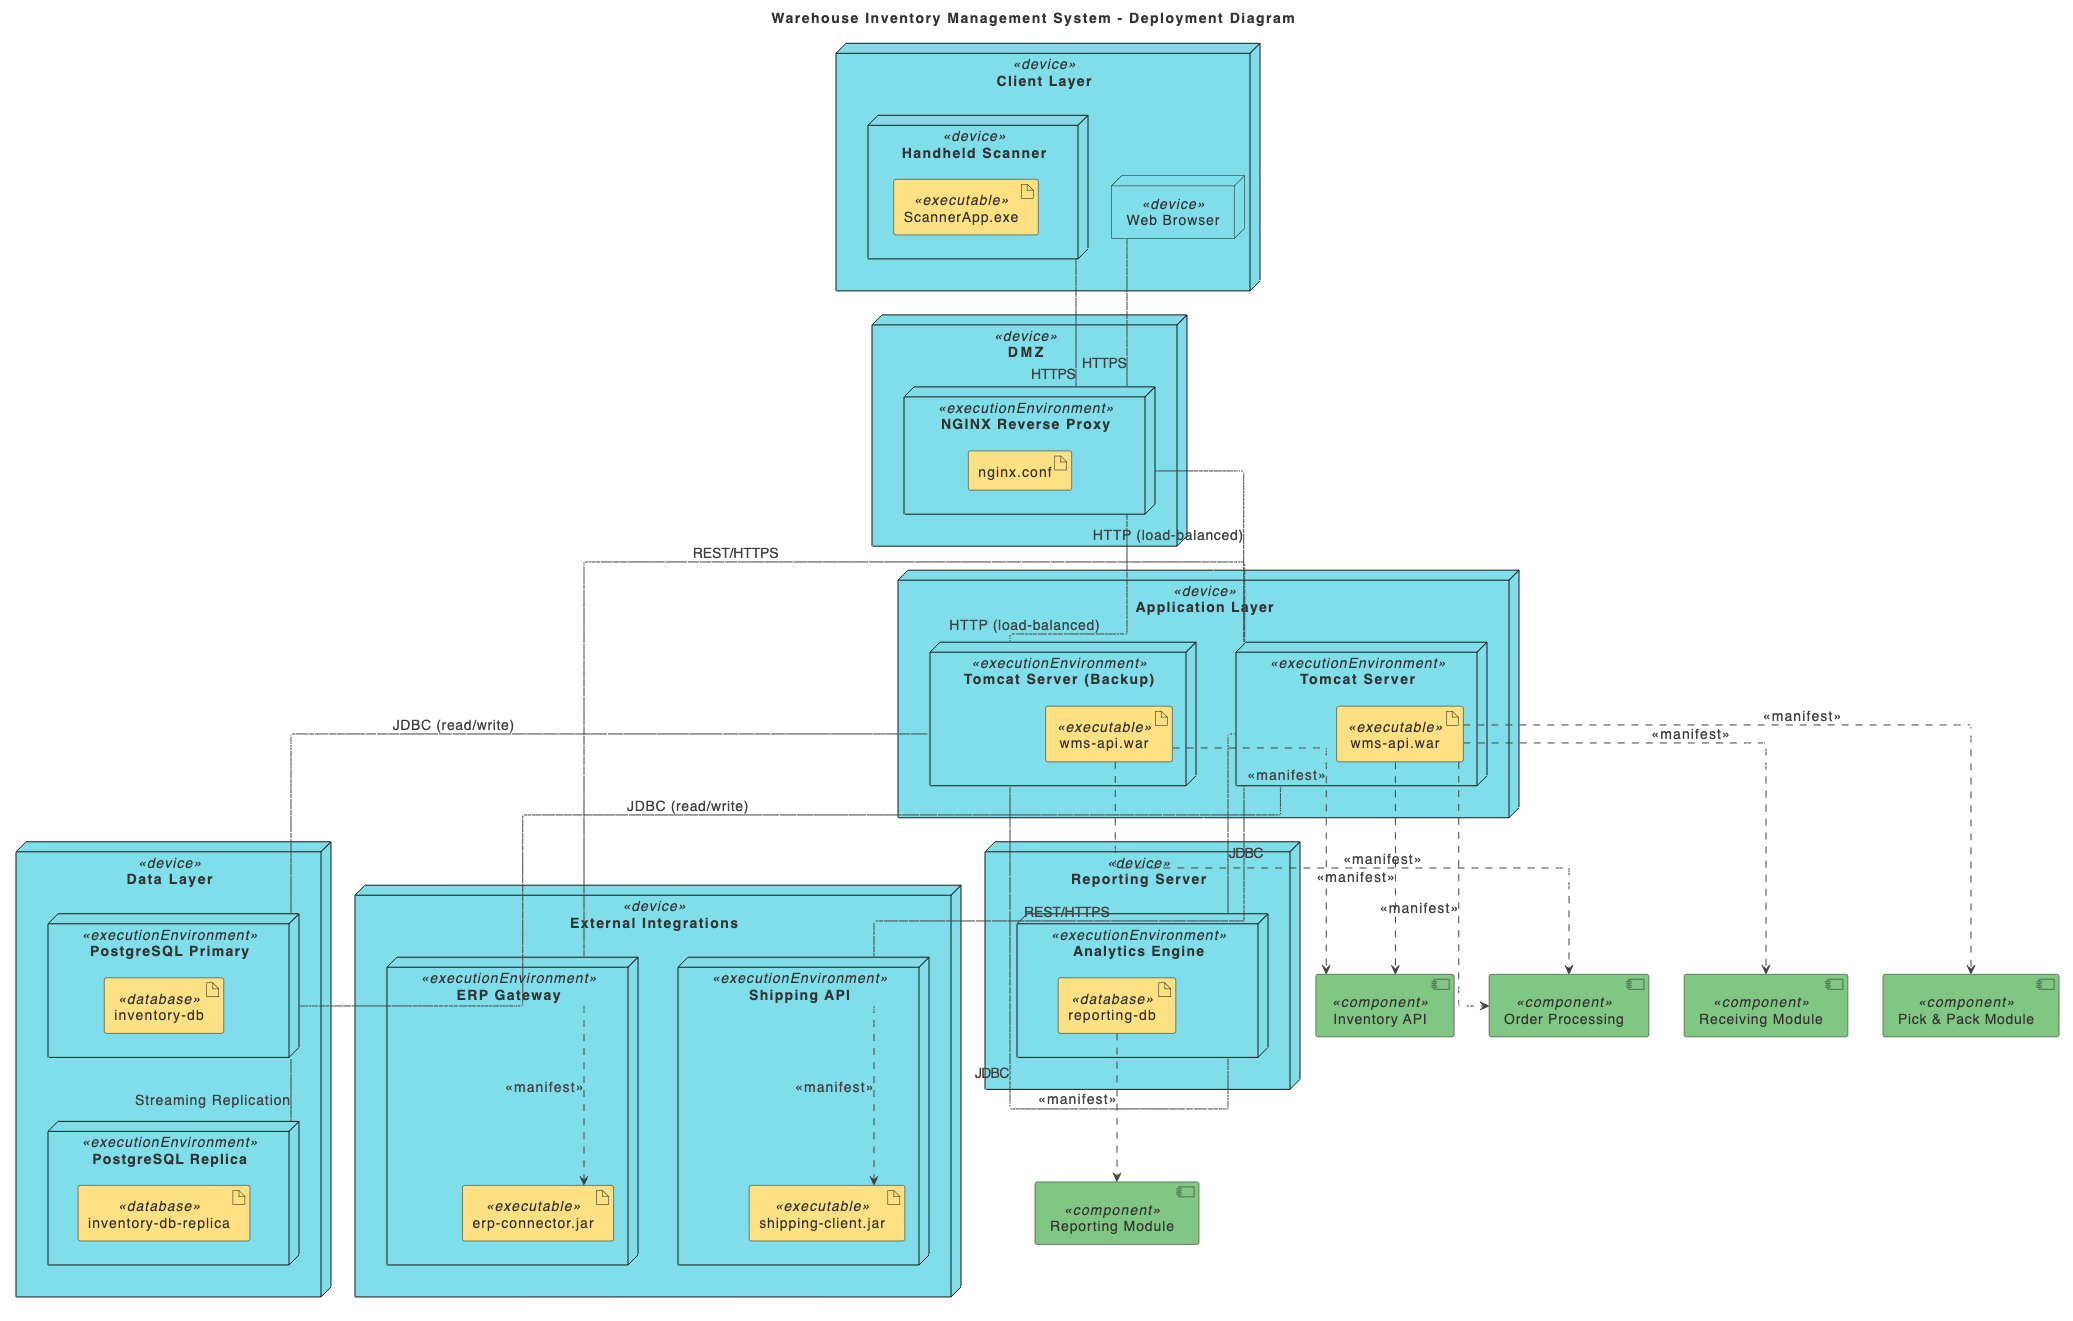
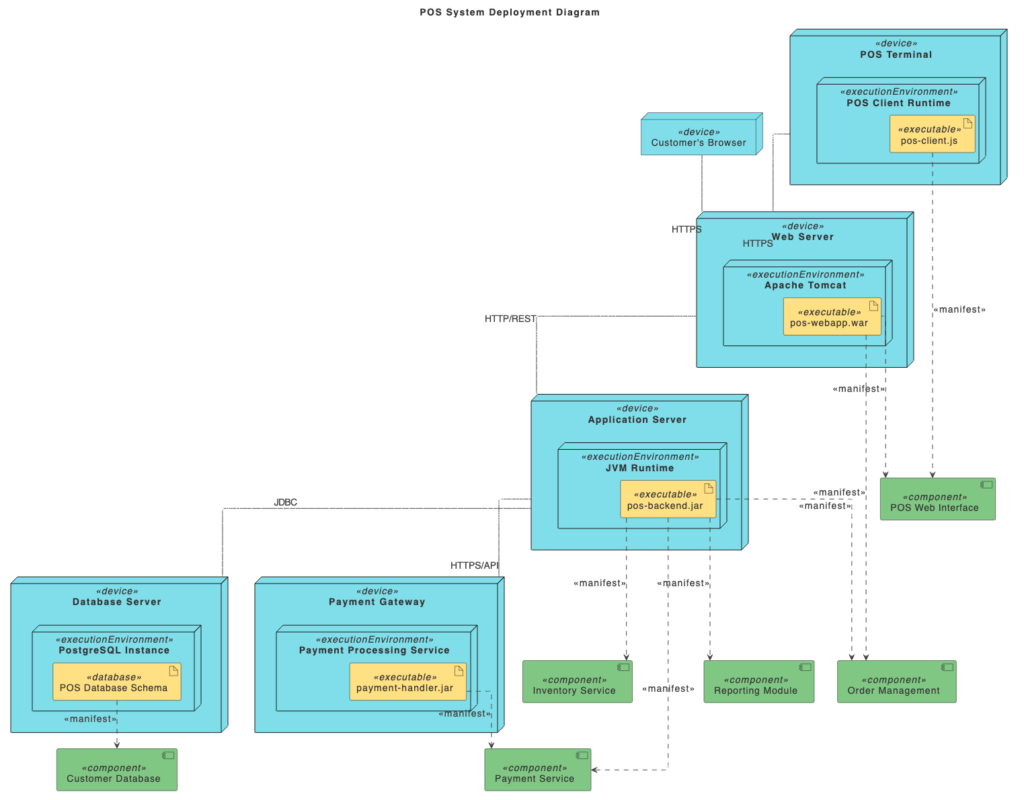
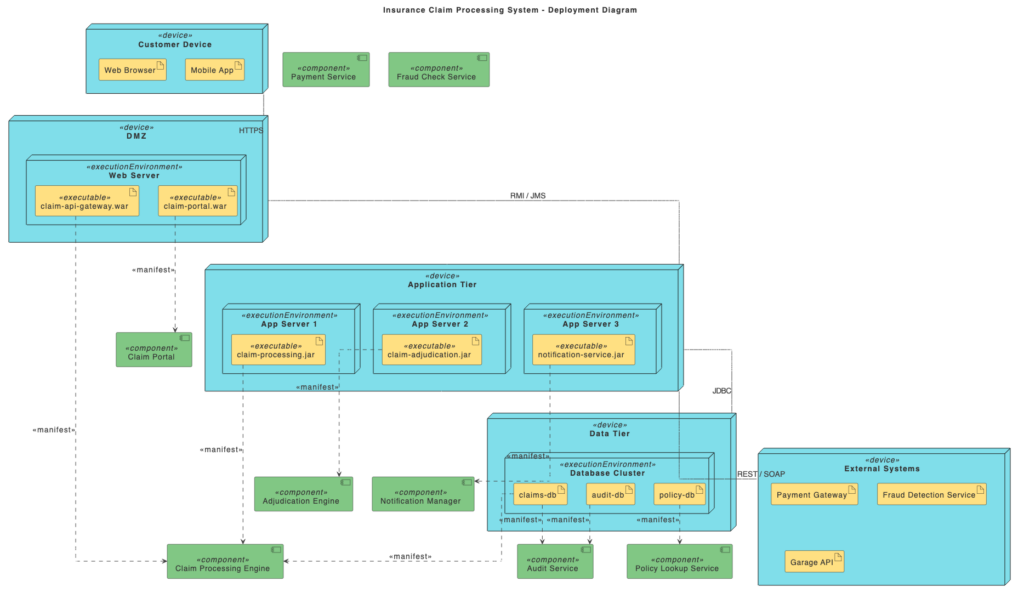
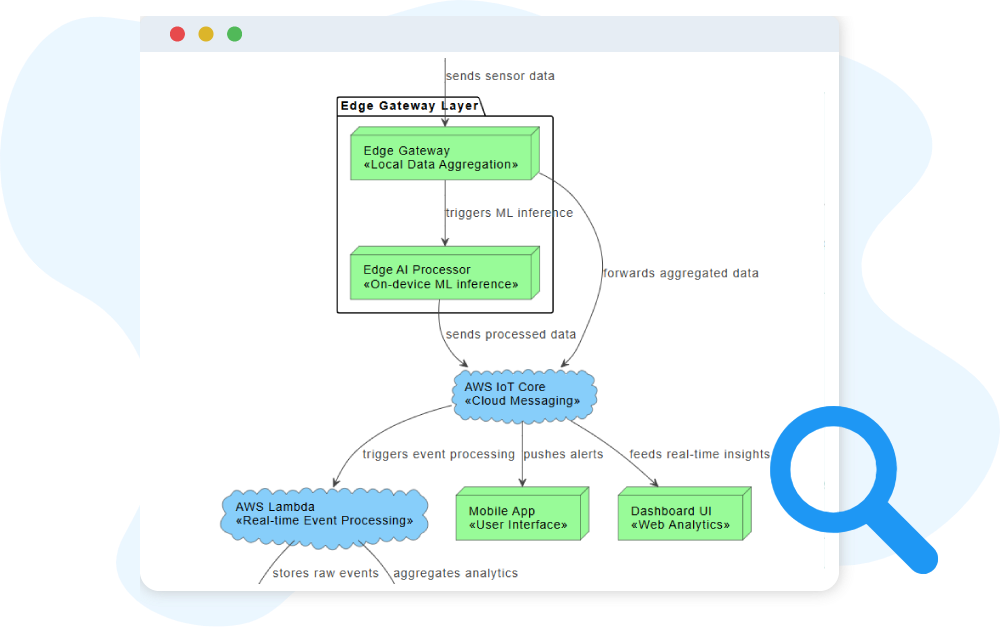
A UML Deployment Diagram shows how your software components are physically deployed across hardware devices, virtual machines, cloud services, and network systems. It provides a clear picture of the runtime environment, highlighting where each artifact lives and how nodes communicate with one another.

This diagram is especially valuable for understanding operational structure. It illustrates the infrastructure that supports your applications—servers, containers, communication links, and execution environments—helping architects and engineers design systems that are scalable, secure, and maintainable.

Key Concepts

Deployment Diagram

A deployment diagram is a UML diagram that shows the physical architecture of a system. It models how software components (like executables, databases, or files) are deployed on hardware or cloud infrastructure.

A component is a modular part of the system, representing software code or functionality (e.g., a web service, module, or API). In deployment diagrams, components are placed inside nodes to show where they run.

A cloud symbol represents deployment to a cloud environment (e.g., AWS, Azure, GCP). It indicates that nodes and components are hosted in cloud infrastructure.

A file is an artifact representing a stored document, script, configuration, or other data file. It can be deployed to nodes just like executables or libraries.

Node

A node is a physical or virtual computing resource, such as a server, device, or cloud instance. Nodes are drawn as 3D boxes and can host components and artifacts.

An artifact is a physical file created during development, such as executables, libraries, configuration files, or documents. Artifacts are deployed inside nodes.

A database is a storage element within the deployment diagram, shown with the classic cylinder shape. It represents where structured data is stored and accessed.

A dependency shows that one element relies on another. For example, a web application component might depend on a database. It is drawn as a dashed arrow pointing from the dependent element to the provider.

Ready to Revolutionize Your Workflow with AI?

Stop wrestling with tools. Embrace AI-powered visual modeling. Let our AI handle the visualization so you can focus on solving the bigger problems.

Scroll to Top