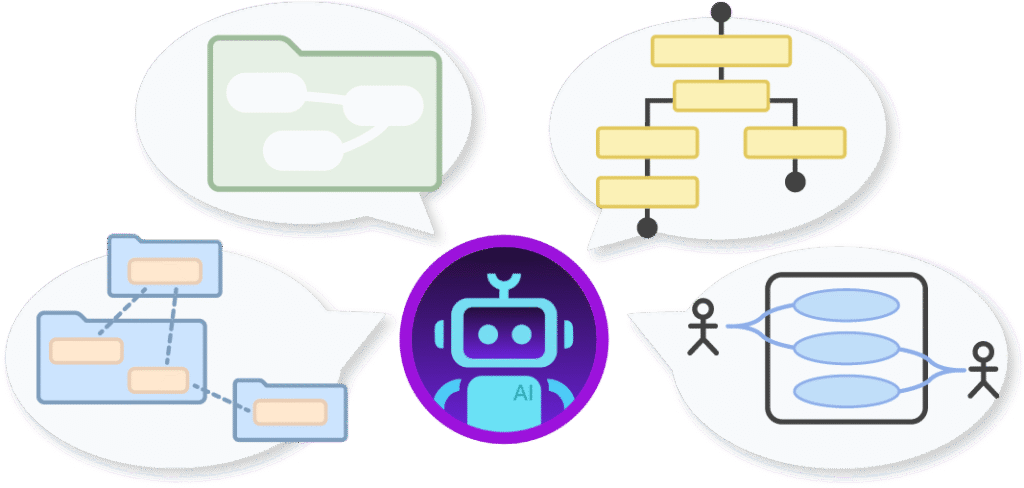
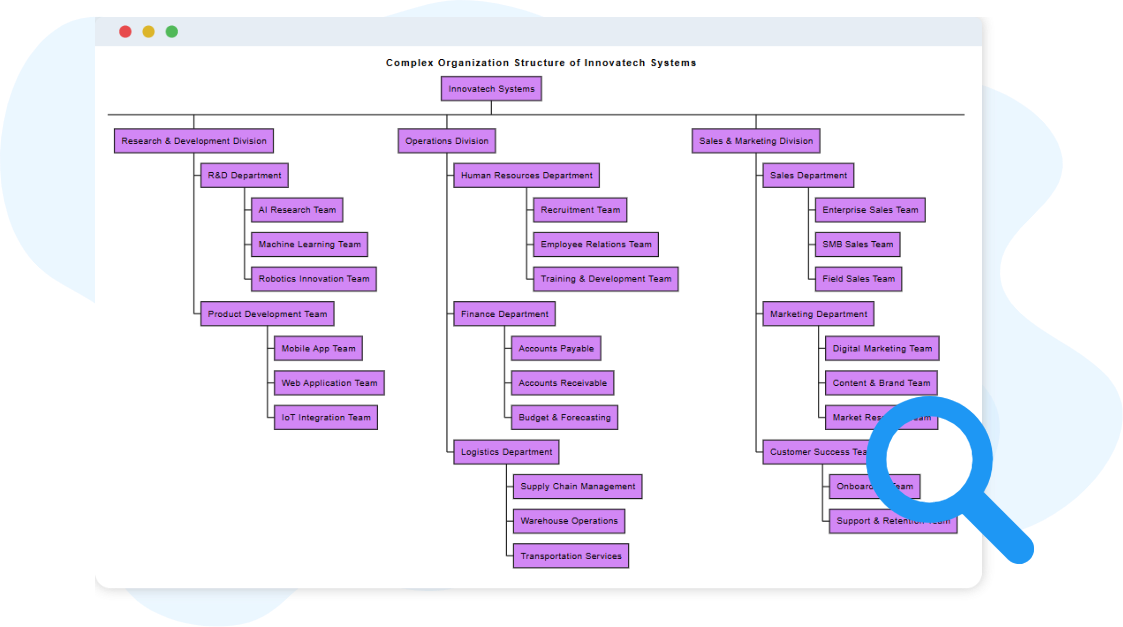
Organization charts turn complex team structures into clear visual hierarchies, showing roles, reporting lines, and departmental relationships at a glance.
Instant Organization Chart Creation
With the AI chatbot, you can convert team information into a polished organization chart instantly. Simply describe your departments, roles, or reporting structure, and the AI arranges everything into a clean visual hierarchy. Instead of manually aligning boxes, drawing connectors, or restructuring layouts, you receive an organized, presentation-ready chart in seconds.
Refine and Explore Structure Through Conversation
After the chart is generated, you can continue shaping it naturally through follow-up prompts. Add new team members, adjust reporting lines, reorganize departments, or request alternative layout styles—all through simple conversational instructions. The AI updates the chart immediately, allowing your organizational structure to evolve as your team grows or plans change.
Benefits of Creating Organization Charts with the AI Chatbot
Turn written team descriptions into structured org charts instantly
Add or modify roles, teams, and reporting lines through conversation
Visualize hierarchies and departmental relationships clearly
Save time on manual formatting and diagram adjustments
Explore alternative structures for planning or restructuring
Improve communication with clear, shareable team diagrams
Keep organizational information updated with minimal effort
Examples of Generating Organization Chart
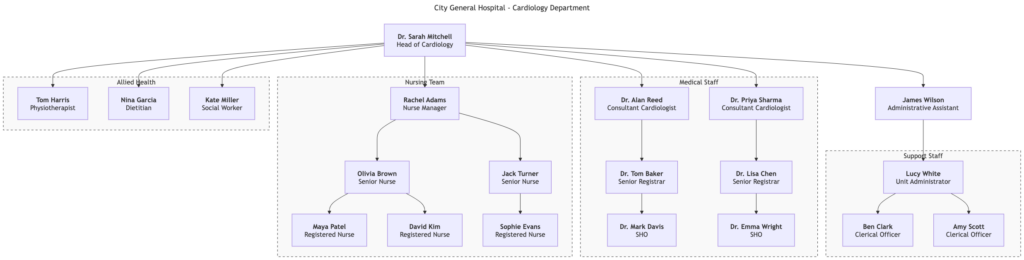
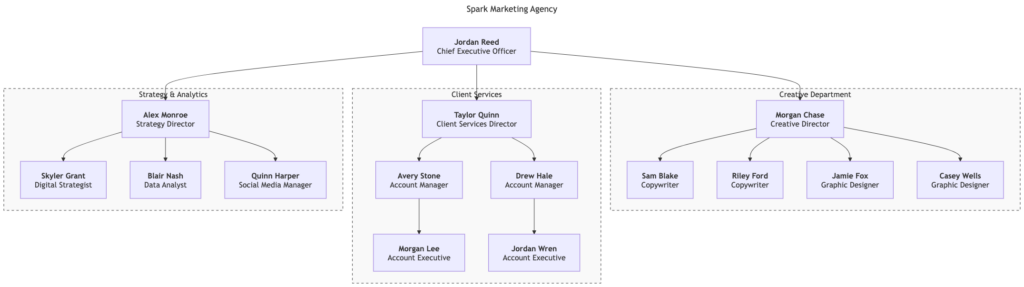
Use simple text prompts to generate this diagram in seconds. Here are a few examples to get you started:
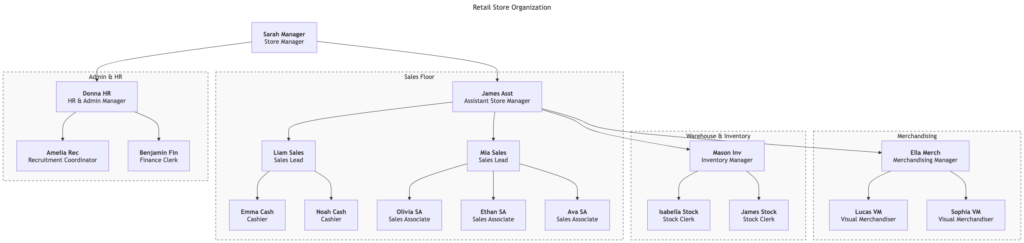
Retail Store
“Generate an organization chart for a retail store. “
An organization chart is a visual map that shows how people, teams, and departments are arranged within a company. It illustrates reporting relationships—from executives to managers to individual contributors—making it easy to understand how responsibilities and decision-making flow through the organization.
Organization charts help employees, managers, and stakeholders understand who does what, who supervises whom, and how different units connect. They support onboarding, resource planning, team restructuring, and communication by presenting the organization’s structure in a simple, hierarchical format that is easy to reference and update.
Key Concepts
Organization Chart
An Organization Chart visually represents the hierarchical structure of an organization, showing reporting relationships between positions, departments, or individuals. It helps clarify roles, responsibilities, and the chain of command, making it easier to understand how the organization is structured and managed.
Organization Unit
An Organization Unit represents a specific division, department, or team within the organizational hierarchy. Each unit typically has a defined function, a leader or manager, and relationships to other units. These units together form the overall organizational framework.
Ready to Revolutionize Your Workflow with AI?
Stop wrestling with tools. Embrace AI-powered visual modeling. Let our AI handle the visualization so you can focus on solving the bigger problems.