

Designing a Ride-Sharing System with AI-Powered Precision
Building a scalable, maintainable architecture for a ride-sharing application demands more than just drawing boxes and arrows. It requires a deep understanding of component responsibilities, data flows, and system boundaries. The challenge lies in translating business logic—such as dynamic pricing and real-time matching—into a clear, standardized visual model. That’s where the Visual Paradigm AI Chatbot steps in, not as a passive diagram generator, but as a collaborative modeling partner.
From Prompt to Architecture: A Conversational Design Journey
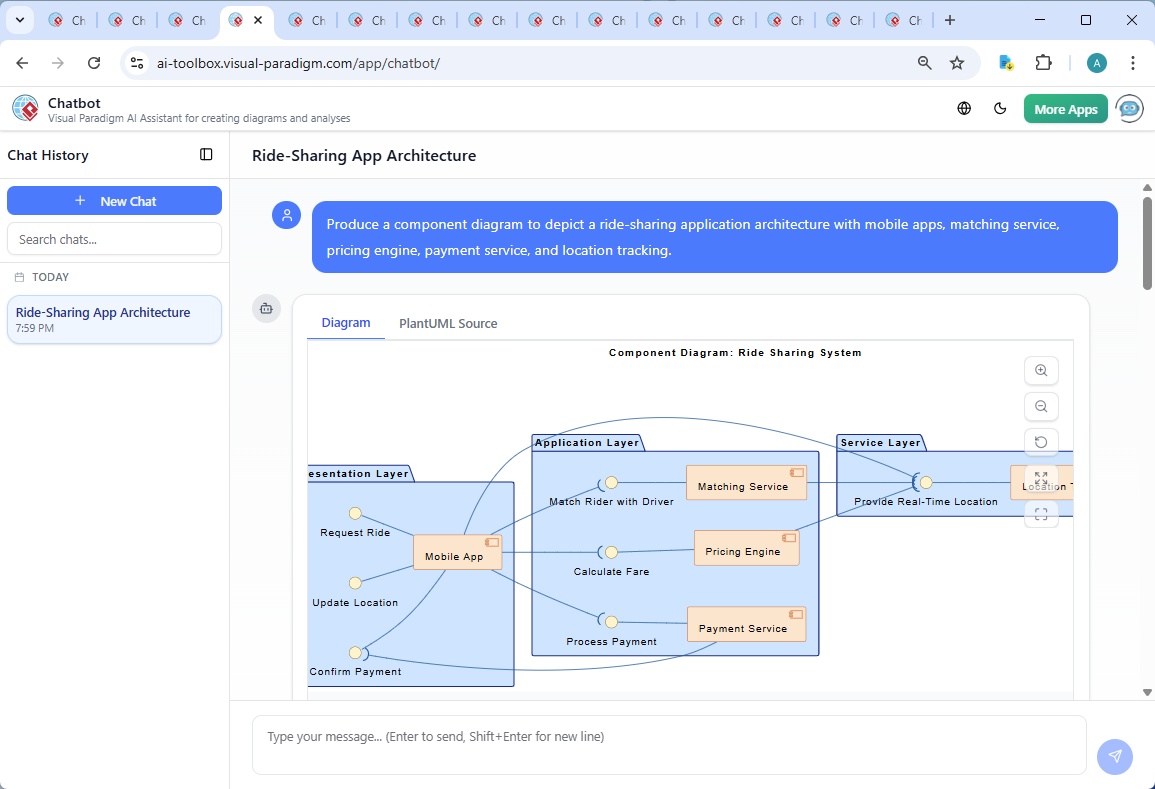
The process began with a simple request: “Produce a component diagram to depict a ride-sharing application architecture with mobile apps, matching service, pricing engine, payment service, and location tracking.” Within seconds, the AI Chatbot responded with a fully structured PlantUML script—complete with layered packages, component boundaries, and interface connectors. But this wasn’t just rendering; it was intelligent design.
As the user explored the model, they asked a critical follow-up: “What data does the Pricing Engine require from the Location Tracking Service to calculate fares?” The AI didn’t just list inputs—it provided a structured, contextual breakdown of the data types, their purpose, and real-world implications. For instance, it explained how traffic congestion and geofencing rules influence surge pricing, and how start/end coordinates enable distance-based calculations.
When the user requested refinement—“Explain this branch”—the AI clarified the data dependency between the Pricing Engine and Location Tracking Service, emphasizing that real-time location data isn’t just a feature—it’s a core pricing enabler. This level of responsiveness turns the chatbot into a domain expert, guiding the user through architectural decisions with clarity and depth.
Component Diagram Logic: How the Architecture Works
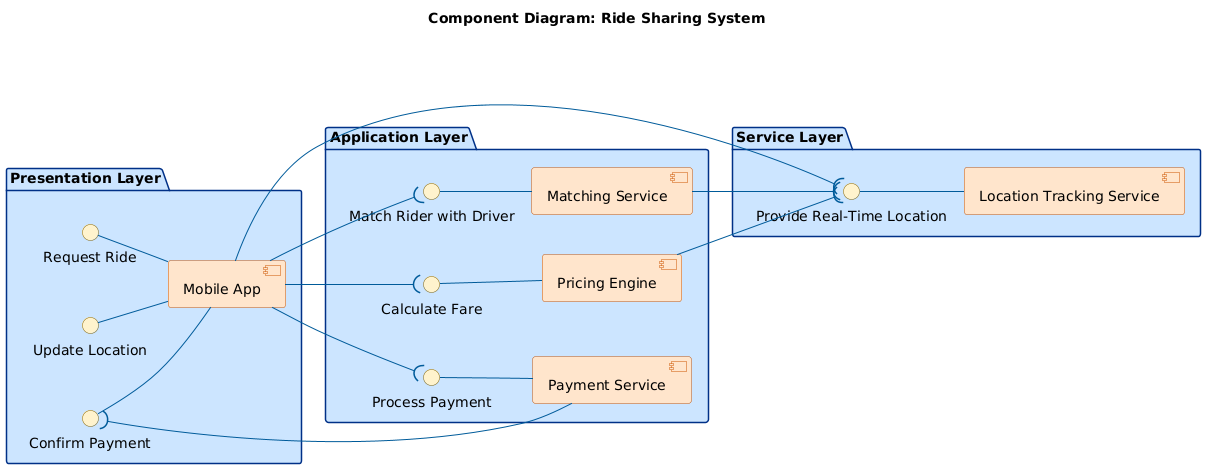
The final diagram reflects a layered, service-oriented architecture, designed for scalability and maintainability:
1. Presentation Layer
Contains the Mobile App, which serves as the user-facing interface. It exposes three key interfaces:
Request Ride– Triggers the matching process.Update Location– Sends real-time GPS updates to the tracking service.Confirm Payment– Confirms successful transaction with the payment service.
2. Application Layer
This is the core logic hub, housing:
- Matching Service – Uses location and availability data to pair riders with drivers.
- Pricing Engine – Calculates fares based on distance, time, and traffic.
- Payment Service – Processes payments and handles transaction confirmations.
3. Service Layer
Contains the Location Tracking Service, which provides:
Provide Real-Time Location– Supplies GPS coordinates and timestamps.
Key Data Flows
- The
Mobile Appsends location updates to theLocation Tracking Service. - The
Pricing Enginepulls start/end coordinates, travel time, and traffic data from the tracking service to compute fare. - The
Matching Serviceuses location data to find nearby drivers. - The
Payment Servicereceives confirmation from the app and processes the transaction.
These flows are represented using interface connectors and component dependencies—ensuring the diagram adheres to UML standards while remaining intuitive to developers, architects, and stakeholders.
AI as a Modeling Consultant: Beyond Diagram Generation
What sets Visual Paradigm apart is the AI Chatbot’s ability to function as a conversational design expert. It doesn’t just generate diagrams—it engages in iterative refinement. The chat history shows how the user asked for clarification, and the AI responded with technical depth, business context, and even real-world examples (e.g., surge pricing in downtown San Francisco).
Each interaction added value:
- Clarified data dependencies between components.
- Justified architectural decisions (e.g., why the Pricing Engine needs real-time location).
- Highlighted how system behavior evolves under different conditions (peak hours, traffic).
This isn’t a static diagram—it’s a living model shaped by dialogue. The AI’s ability to explain, refine, and expand on the design ensures that the final output is not just visually accurate, but architecturally sound.
Visual Paradigm: A Multi-Standard AI-Powered Visual Modeling Platform
The AI Chatbot isn’t limited to Component Diagrams. It seamlessly supports UML, ArchiMate, SysML, C4 Model, Mind Maps, PERT Charts, Org Charts, SWOT, PEST, and various data visualization types. Whether you’re modeling enterprise systems with ArchiMate, designing complex embedded systems with SysML, or visualizing organizational structure with Org Charts, the AI adapts to your needs.
This versatility means that the same intelligent assistant can guide you through:
- Designing business processes with ArchiMate.
- Modeling system behavior with SysML.
- Visualizing software architecture with C4 Model.
- Mapping stakeholder interactions in a mind map.
With Visual Paradigm, you’re not just creating diagrams—you’re building a shared understanding across teams, powered by AI that speaks both technical and business language.
Conclusion: Architect with Confidence
Creating a robust ride-sharing architecture is no small task. But with Visual Paradigm’s AI Chatbot, the process becomes intuitive, collaborative, and insightful. From initial concept to detailed data flow analysis, the AI acts as a co-designer—offering precision, context, and clarity at every step.
Explore how the AI can transform your next architecture project. Try the shared session now and experience the future of visual modeling.
Related Links
-
Component Diagram – Wikipedia: A UML diagram that illustrates the organization and dependencies of components in a software system.
-
What is a Component Diagram? – Visual Paradigm: A detailed guide on UML component diagrams, showing how components interact and are structured in software design.
-
Component Diagram Tutorial: Component Diagram Tutorial. Component diagrams provide a simplified, high-order view of a large system. Classifying groups of classes into components supports the interchangeability…
-
UML component diagram shows components , provided and required…: UML Component Diagrams . Component diagram shows components , provided and required interfaces, ports, and relationships between them.