


Designing the Digital News Platform’s Deployment Architecture with AI Intelligence
Building a scalable and resilient digital news platform requires more than just code—it demands a clear understanding of how components interact across devices, servers, and external services. The challenge lies in visualizing the deployment architecture in a way that reflects real-world behavior while remaining precise and actionable. Enter the Visual Paradigm AI Chatbot: not just a diagram generator, but a collaborative modeling partner that transforms high-level ideas into structured, standards-compliant visual models.
From Idea to Diagram: A Conversation That Shapes Architecture
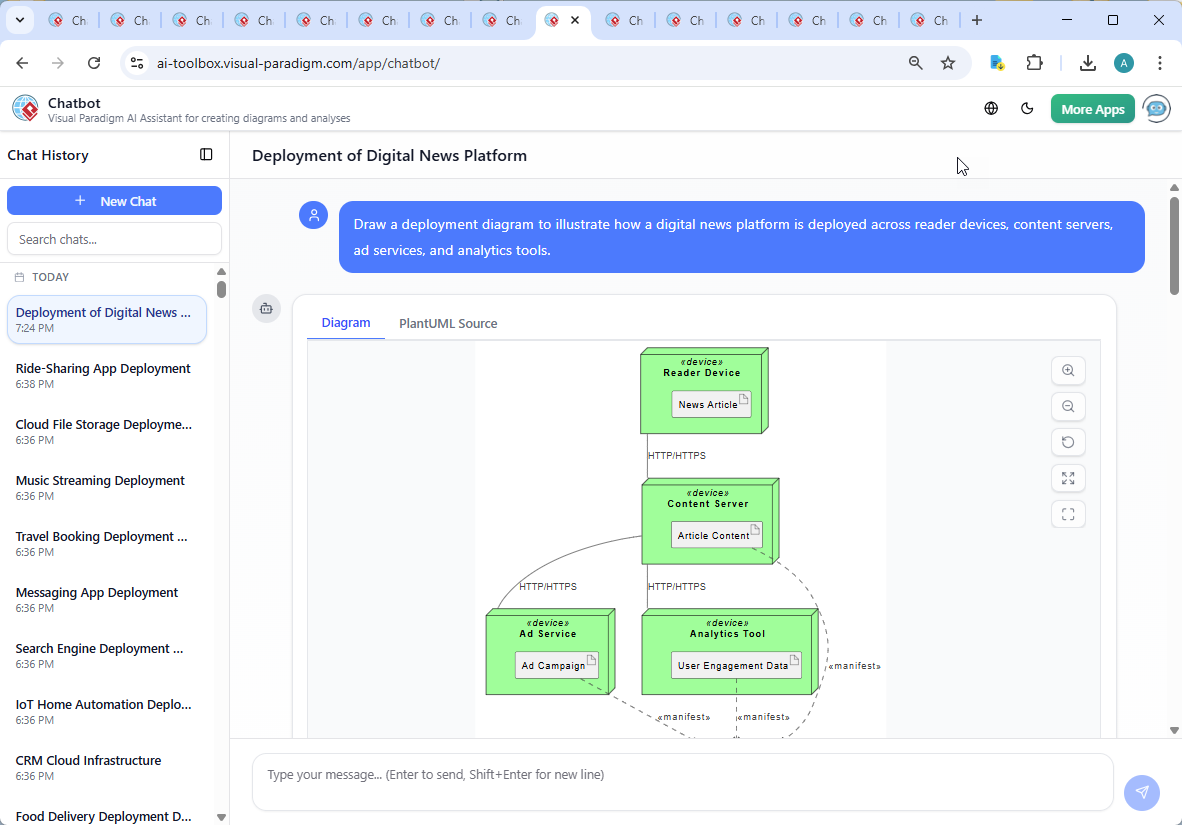
The journey began with a simple prompt: “Draw a deployment diagram to illustrate how a digital news platform is deployed across reader devices, content servers, ad services, and analytics tools.” Within seconds, the Visual Paradigm AI Chatbot delivered a fully formed PlantUML script that captured the core deployment structure. But this wasn’t just a static output—it was the first step in a dynamic conversation.
When the user asked, “Can you explain how the ‘News Article’ artifact on the Reader Device is synchronized with the ‘Article Content’ on the Content Server?” the AI didn’t default to a generic answer. Instead, it offered a nuanced explanation grounded in real-world system behavior: that the reader device doesn’t synchronize content—it retrieves it on demand via HTTP/HTTPS. This insight revealed the AI’s deeper understanding of deployment semantics: it knows that synchronization implies bidirectional data flow, which isn’t how news platforms operate.
The chatbot didn’t stop there. It clarified that the “News Article” on the device is a rendered, temporary copy—not a synchronized version. It even anticipated follow-up needs by suggesting enhancements like diagrams for offline caching or content update flows, showing its role as a proactive design consultant.
Visualizing the Deployment: The Final Architecture
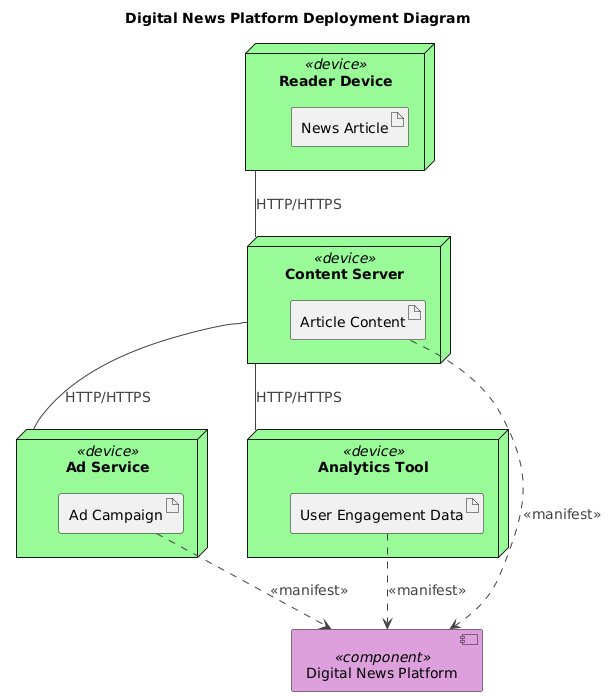
The final deployment diagram reflects a modern, cloud-ready digital news platform. Key elements include:
- Reader Devices: Representing smartphones, tablets, and desktops where users consume content.
- Content Server: The central hub hosting all article content, metadata, and media assets.
- Ad Service: External system that delivers targeted ads, integrated via HTTP/HTTPS.
- Analytics Tool: Monitors user engagement and behavior, feeding data back into the platform.
Each component is clearly defined using UML deployment notation. The use of node elements for physical devices and component for logical units ensures clarity in the architecture. Arrows between nodes represent network communication—specifically, HTTP/HTTPS requests for content delivery, ad fetching, and analytics reporting.
Decoding the Logic: Why This Architecture Works
The diagram’s logic is rooted in real-world software delivery patterns:
- On-Demand Content Delivery: The
Content Serveracts as a central source of truth. When a user requests an article, theReader Devicesends an HTTP request, and the server responds with the latest version. This model ensures content consistency and reduces redundancy. - One-Way Data Flow: The diagram avoids any indication of synchronization. The
News Articleartifact on the device is not a copy that updates the server—it’s a transient, rendered version. This reflects the reality that content is served, not synchronized. - External Service Integration: The
Ad ServiceandAnalytics Toolare deployed externally, connected via HTTP/HTTPS. This modular design allows for independent scaling, updates, and security controls. - Manifest Relationships: The
artifact ..> componentnotation shows that the content, ad campaigns, and engagement data are delivered to the platform as part of its operational workflow—highlighting how data flows into the system.
These choices aren’t arbitrary. The AI Chatbot applied domain knowledge to ensure the diagram aligns with industry best practices in digital content platforms, avoiding common misconceptions like bidirectional content sync.
Conversational Intelligence in Action
The true power of the Visual Paradigm AI Chatbot lies in its ability to engage in intelligent dialogue. The conversation wasn’t a one-way exchange—it was a collaborative design session. Each follow-up question was treated as a refinement opportunity:
- When asked to explain the synchronization logic, the AI didn’t just describe the diagram—it explained the underlying system behavior, reinforcing architectural accuracy.
- The AI offered to extend the model to show offline caching or push-based updates, demonstrating its adaptability to evolving requirements.
- By using precise UML syntax and semantic annotations (e.g., <>, <>, <>), it ensured the diagram was not just visually appealing but also technically valid.
This level of conversational depth sets Visual Paradigm apart. It’s not a tool that generates diagrams—it’s a modeling expert that learns from the user’s intent and responds with architectural wisdom.
More Than Just Deployment: A Full Modeling Suite
While this example focused on a deployment diagram, the Visual Paradigm AI Chatbot is built to handle a full spectrum of modeling standards. Whether you’re designing enterprise systems with ArchiMate for business architecture, modeling complex systems with SysML, visualizing software architecture using the C4 Model, or mapping strategic ideas with Mind Maps, the AI adapts to your needs.
It also supports SWOT, PEST, Org Charts, PERT Charts, and various data visualization types (column, area, pie, line), making it a unified platform for all visual modeling tasks—from strategy to implementation.
Conclusion: Your AI Modeling Partner
Creating a deployment diagram for a digital news platform isn’t just about drawing boxes and lines—it’s about capturing the real-world dynamics of how systems interact. The Visual Paradigm AI Chatbot turns this challenge into a collaborative, intelligent process, guiding users through design decisions with clarity and precision.
Whether you’re an architect, developer, or product manager, the platform empowers you to think visually, act decisively, and model accurately—without needing to master complex notation.
Ready to bring your next system to life? Explore the full session and experience how AI transforms visual modeling.