

Designing a High-Performance Stock Trading Platform with AI-Powered Precision
Building a real-time stock trading platform demands architectural clarity, especially when integrating trader terminals, trading engines, market data feeds, and clearing systems. The complexity of real-time data flow, low-latency execution, and post-trade settlement requires a modeling approach that’s both accurate and adaptable. This is where the Visual Paradigm AI Chatbot steps in—not as a diagram generator, but as a collaborative design partner.
From Prompt to Architecture: A Collaborative Design Journey
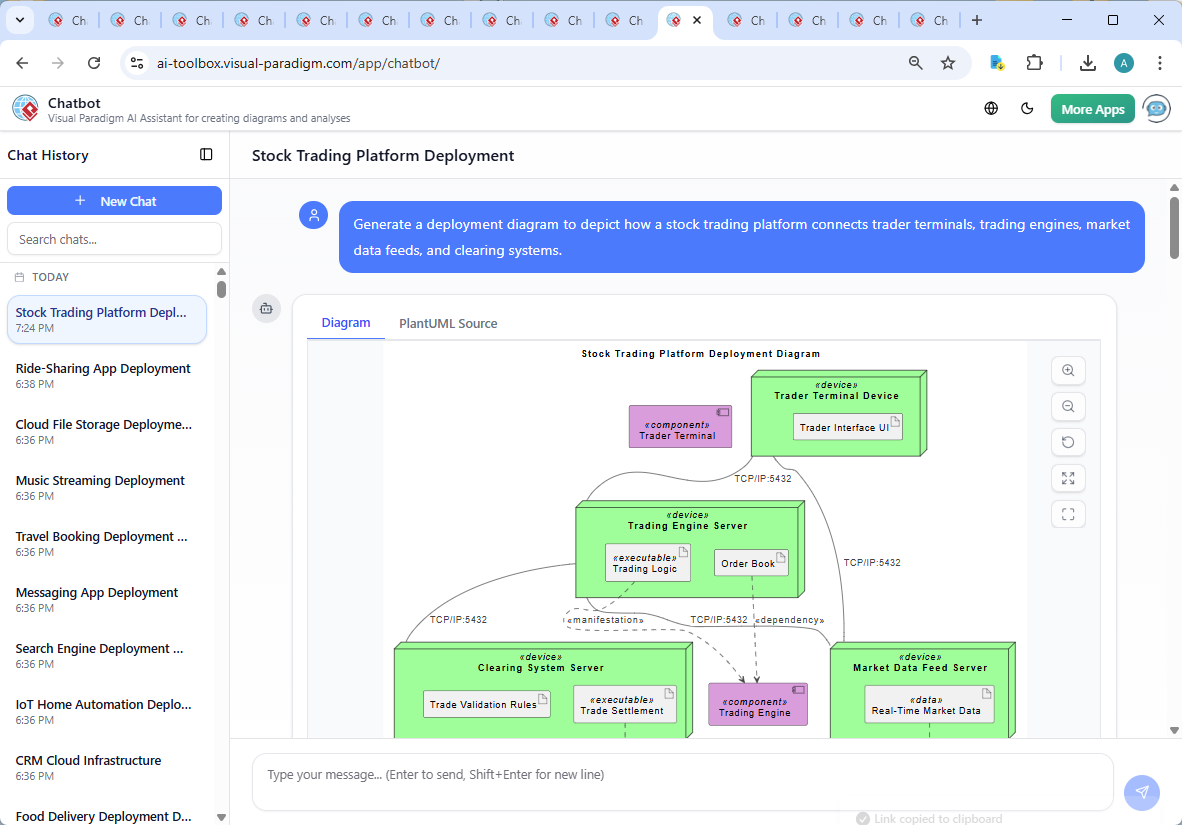
The journey began with a simple request: “Generate a deployment diagram to depict how a stock trading platform connects trader terminals, trading engines, market data feeds, and clearing systems.” Within seconds, the AI Chatbot responded with a fully structured PlantUML script, already incorporating best practices in deployment modeling.
But the conversation didn’t stop there. When the user asked, “Explain this diagram,” the AI didn’t just repeat the code—it transformed into a technical consultant, breaking down each node, component, and connection with clear context. It highlighted how the trader terminal communicates via TCP/IP to the trading engine server, and how the market data feed supplies real-time pricing critical for order execution.
When the user followed up with, “Explain this branch,” the AI clarified the dependency between the Order Book and the Trading Engine, emphasizing its role in market depth analysis. Later, the user requested a deeper dive into protocols—prompting the AI to explain why TCP/IP:5432 was used symbolically and how real-world systems often use FIX or WebSocket protocols.
This back-and-forth wasn’t just a Q&A—it was a co-design session. The AI demonstrated real-time reasoning, adjusting explanations based on user intent, refining logic, and offering next-step suggestions like adding C4 structure or a sequence diagram for order flow.
Decoding the Deployment Diagram: Architecture in Action
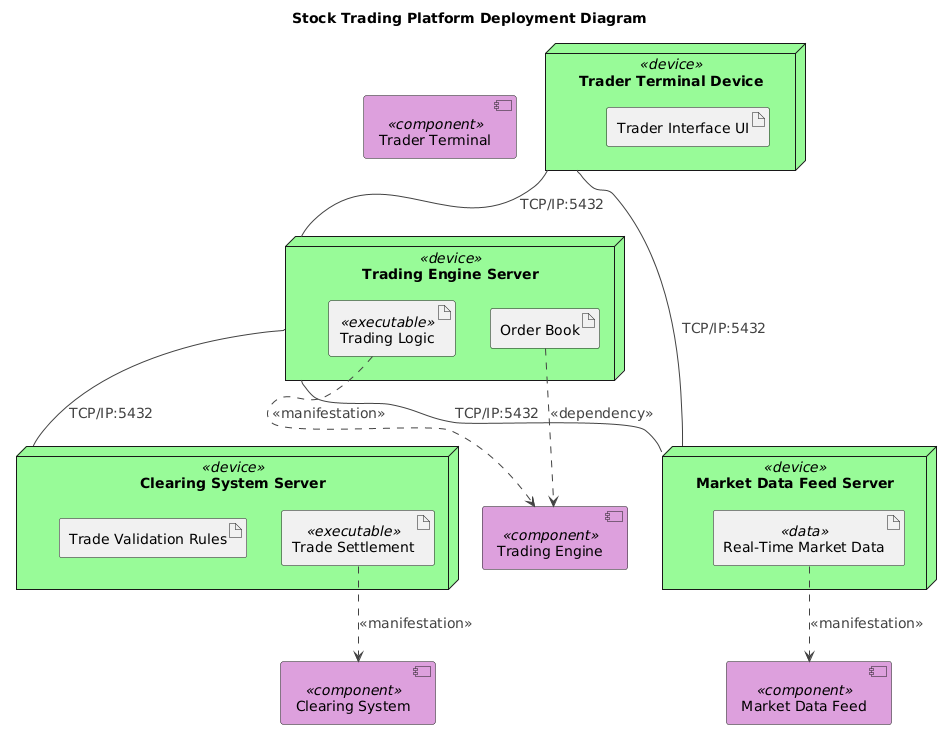
The generated diagram is more than a visual—it’s a blueprint of operational flow. Here’s how each element contributes to the system’s integrity:
Nodes: Physical and Logical Infrastructure
- Trader Terminal Device – Represents the end-user workstation where traders input orders and receive live data.
- Trading Engine Server – Hosts the core logic for order validation, execution, and settlement coordination.
- Market Data Feed Server – Delivers real-time price updates from exchanges, enabling informed trading decisions.
- Clearing System Server – Manages post-trade processes, including trade validation and financial settlement.
Components: Software Artifacts and Services
- Trader Interface UI – The front-end layer for traders to interact with the system.
- Trading Logic – Executes business rules, checks order validity, and manages trade lifecycle.
- Order Book – Maintains current bid/ask levels and volumes, essential for execution pricing.
- Real-Time Market Data – Live feed from exchanges, used by both traders and the engine.
- Trade Settlement – Finalizes trades after execution, ensuring financial accuracy.
- Trade Validation Rules – Enforces limits, risk controls, and compliance checks.
Communication and Dependencies
The connections reflect real-world data flow:
- Trader Terminal → Trading Engine: Orders are sent for processing.
- Trader Terminal → Market Data Feed: Live price updates are displayed.
- Trading Engine → Market Data Feed: The engine queries market depth for optimal execution.
- Trading Engine → Clearing System: Executed trades are sent for validation and settlement.
- Order Book → Trading Engine: The engine uses the order book to assess liquidity.
The use of TCP/IP:5432 is symbolic—representing the underlying network protocol stack. In production, systems often use high-performance protocols like FIX or WebSocket, but the diagram prioritizes clarity over technical minutiae.
Conversational Intelligence: Where the AI Adds Real Value
What sets the Visual Paradigm AI Chatbot apart is its ability to function as a modeling expert in real time. The chat history proves this: it didn’t just generate a diagram—it explained, refined, and expanded the design based on user feedback.
When the user asked to “explain this branch,” the AI didn’t default to generic definitions. Instead, it contextualized the Order Book as a dynamic data structure that directly influences trade execution speed and accuracy. When asked for protocol details, it acknowledged the symbolic nature of the port while suggesting real-world alternatives.
These interactions demonstrate that the AI isn’t just a code generator—it’s a conversational design assistant, capable of understanding architectural intent and responding with domain-specific insights.
Beyond Deployment: A Full Modeling Suite
While this example focused on a Deployment Diagram, the Visual Paradigm AI Chatbot is built to support a wide range of modeling standards—making it a true AI-powered visual modeling platform.
Whether you’re designing enterprise architecture with ArchiMate, modeling complex systems with SysML, or visualizing system structure using the C4 Model, the AI Chatbot adapts to your needs. It understands the nuances of each standard and can generate diagrams in any format—from UML class diagrams to SWOT and PEST analysis charts.
This versatility means you’re not limited to one type of diagram. You can start with a deployment model, then quickly generate a C4 context diagram to show system boundaries, or a sequence diagram to map the order execution flow—each with the same level of AI-driven intelligence.
Conclusion: Designing with Confidence, Powered by AI
The real-time stock trading platform deployment diagram isn’t just a visual—it’s a living design artifact shaped by a collaborative conversation between human and AI. The Visual Paradigm AI Chatbot delivered precision, clarity, and adaptability at every step.
Whether you’re a developer, architect, or stakeholder, this platform enables you to translate complex ideas into accurate, shareable models—without needing to master modeling syntax or tooling.
Ready to design your next system with AI intelligence? Explore the full chat session and experience the future of visual modeling.