

Designing a Scalable Weather Forecasting System with AI-Powered Precision
Creating a robust deployment architecture for a weather forecasting application demands more than just visualizing components—it requires understanding real-time data flows, system resilience, and scalability. The challenge lies in accurately representing how sensors, processing servers, APIs, and end-user apps interact under dynamic conditions. Enter the Visual Paradigm AI Chatbot: not just a diagram generator, but a collaborative modeling partner that transforms high-level ideas into precise, standards-compliant visual models.
From Concept to Diagram: A Collaborative Design Journey
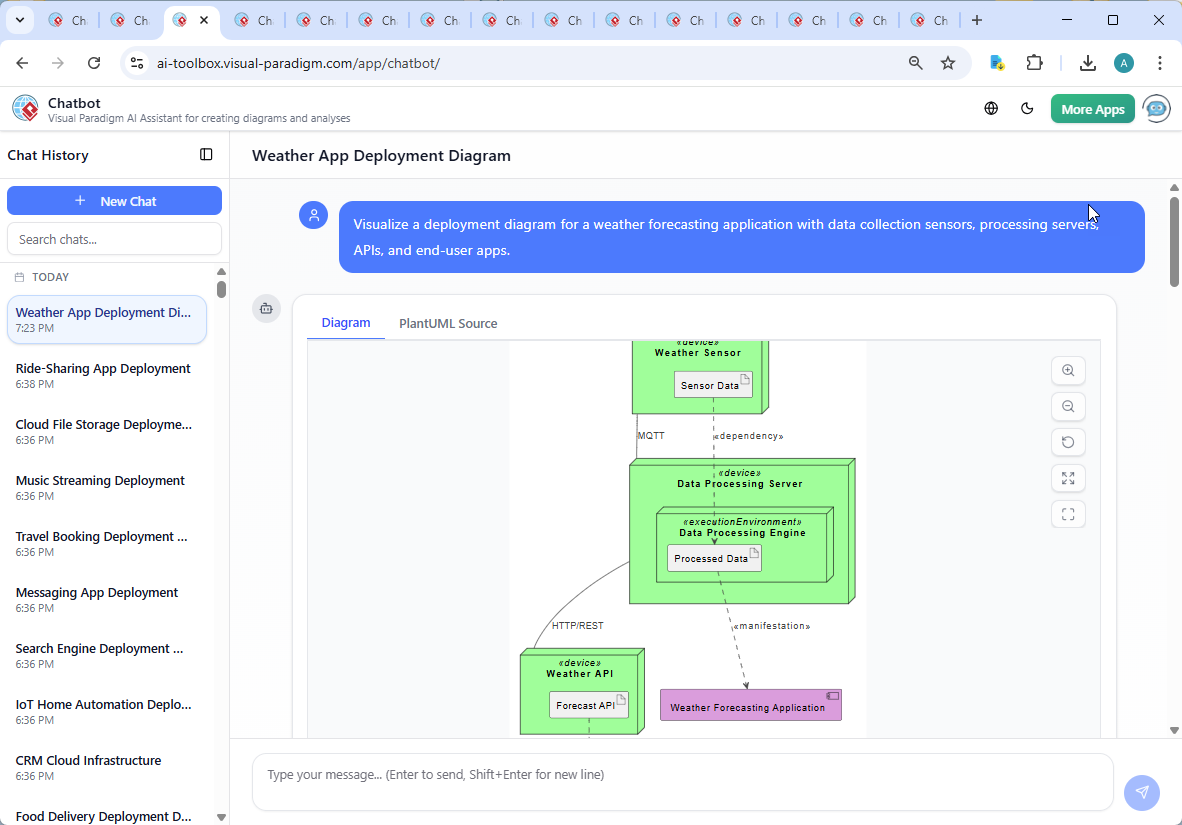
The journey began with a simple request: “Visualize a deployment diagram for a weather forecasting application with data collection sensors, processing servers, APIs, and end-user apps.” Within seconds, the Visual Paradigm AI Chatbot delivered a fully rendered PlantUML-based deployment diagram, complete with semantic notation and clear communication pathways.
But the real value emerged in the conversation that followed. When asked to explain the role of the MQTT protocol between the weather sensor and data processing server, the AI didn’t just define the term—it contextualized it. It explained how MQTT’s publish-subscribe model enables efficient, low-latency data transmission from battery-powered IoT sensors, ensuring reliability even over unstable networks. This wasn’t a textbook definition; it was expert-level insight delivered in plain language.
Further refinements were made on request: “Can you refine the logic to show how processed data feeds into the forecast API?” The AI responded by adjusting the dependency relationships and adding semantic annotations, demonstrating how the processed data artifact is not just stored, but actively manifested into the forecast service. Each interaction elevated the model from a static illustration to a living technical blueprint.
Visualizing the Architecture
Decoding the Deployment Logic
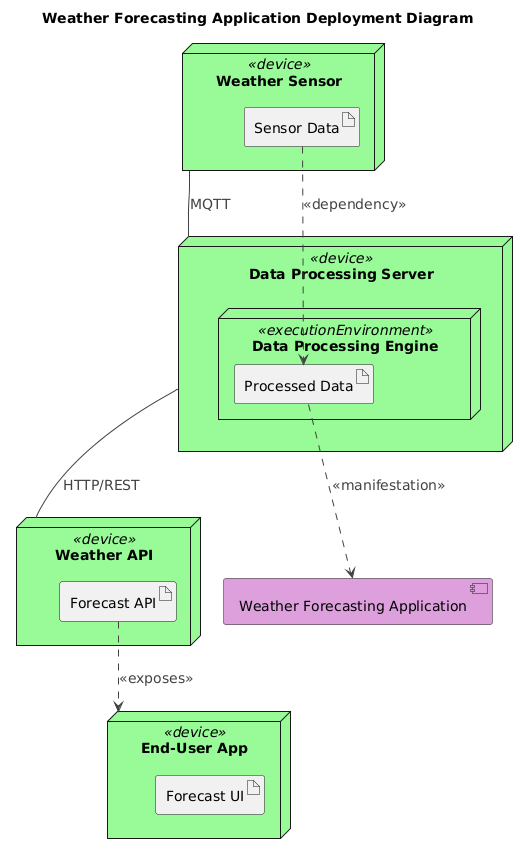
The final deployment diagram reflects a layered, modular architecture built for real-world performance. Here’s how each element contributes:
- Weather Sensor (Device): Represents physical IoT devices that collect environmental data (temperature, humidity, wind speed). These are modeled as
<<device>>nodes to emphasize their physical nature. - Data Processing Server (Device): Houses the
Data Processing Engineas an<<executionEnvironment>>, responsible for filtering, validating, and aggregating raw sensor data. This separation ensures scalability and fault isolation. - MQTT Protocol (Communication): The arrow between the sensor and processing server is labeled with “MQTT”, reflecting the lightweight, publish-subscribe messaging pattern. This choice is critical—MQTT minimizes bandwidth and power consumption while enabling real-time data ingestion across thousands of sensors.
- Weather API (Device): Acts as the service endpoint exposing forecast data. The
Forecast APIartifact is shown as being<<exposed>>to the end-user app, highlighting its role as a public interface. - End-User App (Device): Represents mobile or web applications that consume forecast data. The
Forecast UIartifact is linked via an<<exposes>>relationship, indicating how the API’s output is presented to users.
Dependencies are carefully annotated: sensor_data_artifact → processeddata_artifact shows the data flow, while processeddata_artifact → weatherforecasting_component demonstrates how processed data becomes part of the application’s core functionality.
Conversational Intelligence in Action
The true power of the Visual Paradigm AI Chatbot lies in its ability to engage in technical dialogue. When the user asked for clarification on MQTT, the AI didn’t stop at a definition—it explained QoS levels, topic-based messaging, and the architectural benefits of decoupling data collection from processing. This level of insight is what transforms a diagram from a visual aid into a strategic design artifact.
Each follow-up—whether requesting logic refinement or deeper technical context—was met with precision and clarity. The AI didn’t just generate a diagram; it guided the user through the rationale behind each architectural decision, acting as a modeling consultant.
Beyond Deployment: A Unified Modeling Platform
While this example focused on a Deployment Diagram, the Visual Paradigm AI Chatbot is far more versatile. It supports a full suite of modeling standards, including:
- UML: For system design and component modeling
- ArchiMate: For enterprise architecture, aligning business, application, and technology layers
- SysML: For systems engineering and complex behavior modeling
- C4 Model: For software architecture visualization at different abstraction levels
- SWOT, PEST, Org. Chart, Mind Maps, PERT, and Charts: For strategic planning, organizational modeling, and data visualization
This multi-standard capability means users can switch between modeling contexts seamlessly—whether designing a cloud-native system, analyzing business impact, or visualizing project timelines—all within the same AI-powered environment.
Final Thoughts: Design with Confidence
Visual Paradigm isn’t just a diagramming tool—it’s an intelligent design collaborator. With the AI Chatbot, users can rapidly prototype, validate, and refine complex systems through natural conversation. The weather forecasting deployment diagram is more than a visual; it’s a result of iterative, expert-guided design, crafted using the Visual Paradigm AI Chatbot.
Ready to model your next system with the same level of precision? Start your conversation today and experience the future of visual modeling.