


Transforming Data into Decisions: An AI-Powered ArchiMate View of an Enterprise Analytics Platform
Designing a comprehensive enterprise data analytics platform demands more than technical architecture—it requires a clear, strategic blueprint that aligns business goals with IT capabilities. The challenge lies in visualizing how raw data flows through systems, transforms into insights, and ultimately fuels decision-making across departments. This is where the Visual Paradigm AI Chatbot steps in—not as a passive diagram generator, but as a collaborative modeling expert that understands both the business context and the formal semantics of ArchiMate.
From Prompt to Precision: The Interactive Evolution of the Diagram
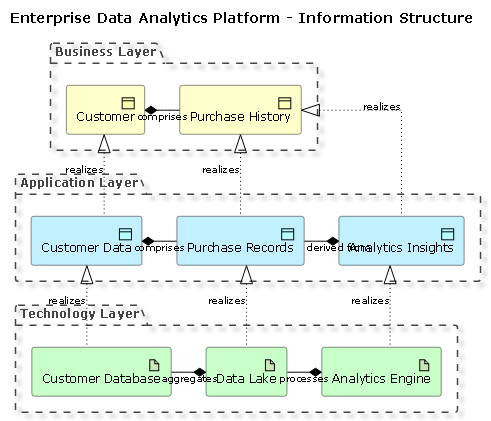
It began with a simple request: “Create an ArchiMate Diagram illustrating an enterprise data analytics platform ingesting data, processing insights, and supporting business decisions.” The AI Chatbot responded with a structured, layered ArchiMate diagram using PlantUML syntax, immediately establishing the platform’s core structure across three key layers: Business, Application, and Technology.
But the conversation didn’t stop there. The user asked: “What types of business decisions could be supported by the Analytics Insights generated in this platform?” Instead of a static list, the AI delivered a rich, categorized breakdown—mapping each insight to real-world decision domains like marketing, product development, sales forecasting, and risk management. This wasn’t just an answer—it was a strategic expansion of the model’s purpose.
Each follow-up—such as “Explain this branch” or “Refine the logic on derived insights”—was met with a precise, context-aware response. The AI didn’t just describe relationships; it justified them. For example, it clarified that Application DataObject Analytics Insights is derived from Purchase Records, not just stored in the same system—highlighting the transformational nature of the analytics layer.
Decoding the Architecture: How the Diagram Tells the Story
The final ArchiMate diagram is more than a visual—it’s a narrative of data transformation. Here’s how each component contributes:
Business Layer: The Foundation of Value
At the top, Business Object Customer and Purchase History represent the core business entities. Their relationship—comprises—shows that customer behavior is built from transactional data, forming the basis for all analytics.
Application Layer: The Intelligence Engine
The Application DataObjects—Customer Data, Purchase Records, and Analytics Insights—form the digital backbone. The realizes relationship between Application DataObject Customer Data and Business Object Customer confirms that the system operationalizes business concepts into data structures.
Crucially, Analytics Insights is derived from Purchase Records, emphasizing that insights aren’t just stored—they’re actively computed, transforming historical data into predictive intelligence.
Technology Layer: The Execution Infrastructure
At the base, Technology Artifacts represent the physical and logical systems:
- Customer Database stores raw customer data.
- Data Lake aggregates data from multiple sources, including the customer database.
- Analytics Engine processes data from the lake and generates insights.
These artifacts are connected via realizes and aggregates relationships, showing how technology enables application functionality and data integration.
Key Notation Choices: Why This Matters
Every relationship in the diagram is semantically precise:
- Realization: Shows how an application or technology element enables or implements a business or application concept.
- Composition: Indicates containment or derivation—e.g., Analytics Insights is composed from Purchase Records, not just linked.
- Aggregation: Highlights data integration—Data Lake aggregates data from multiple sources, including the Customer Database.
This level of fidelity ensures the model is not just visually accurate but also compliant with ArchiMate standards, making it usable for governance, stakeholder alignment, and system design.
Conversational Intelligence: The AI as Your Modeling Partner
What sets this process apart is the two-way dialogue. The AI didn’t just generate a diagram—it invited refinement, explained intent, and anticipated follow-up questions. When asked about decision types, it didn’t stop at listing categories. Instead, it provided concrete examples, such as “We found that 30% of repeat customers are from the 25–35 age group. We will launch a targeted loyalty campaign to this group.”
This kind of contextual reasoning demonstrates the AI’s ability to bridge business strategy and technical modeling—turning abstract data into actionable insights.
Beyond ArchiMate: A Unified Platform for All Modeling Needs
While this example focused on ArchiMate, the Visual Paradigm AI Chatbot is not limited to one standard. It seamlessly supports UML for software design, SysML for systems engineering, and C4 Model for software architecture.
Whether you’re designing a microservices architecture, documenting a business process, or mapping enterprise capabilities, the AI Chatbot adapts to your needs—understanding context, suggesting best practices, and generating standardized diagrams in seconds.
Conclusion: A Smarter Way to Model
Creating an enterprise data analytics platform isn’t just about technology—it’s about alignment. The Visual Paradigm AI Chatbot acts as a collaborative partner, turning natural language prompts into precise, standards-compliant models. Through iterative conversation, it transforms vague ideas into structured, decision-ready architectures.
Explore the full example in the shared session: View the AI-Generated ArchiMate Diagram.
Ready to build your next enterprise model with AI intelligence? Start your conversation today.