

Designing Leadership Clarity in a Fast-Growing Startup: An AI-Powered Approach
Scaling a startup demands more than capital and innovation—it requires a clear, agile organizational structure. As teams grow rapidly, leadership visibility and reporting lines must evolve to avoid confusion, duplication, and misaligned priorities. Traditional diagramming tools often slow this process down, but the Visual Paradigm AI Chatbot transforms the challenge into a dynamic conversation, turning abstract vision into structured, actionable models.
From Vision to Structure: A Collaborative Modeling Journey
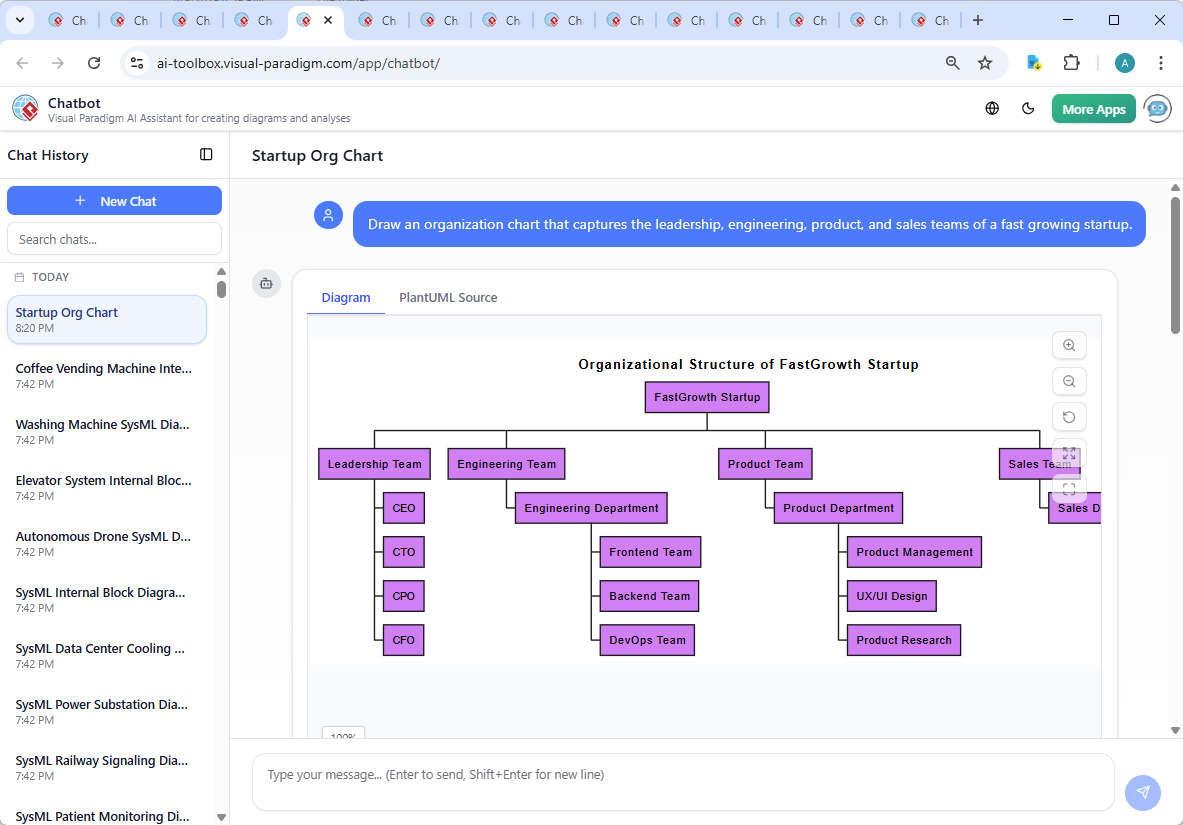
The journey began with a simple prompt: “Draw an organization chart that captures the leadership, engineering, product, and sales teams of a fast-growing startup.” Within seconds, the AI Chatbot responded with a structured PlantUML representation of the startup’s organizational hierarchy. But this wasn’t just a static diagram—it was the first step in a real-time dialogue.
When the user asked, “Can you explain the reporting structure between the CEO and the CTO?”, the AI didn’t just repeat the diagram. It unpacked the rationale: the CTO reports directly to the CEO, ensuring strategic alignment and rapid decision-making—critical in high-growth environments where technical and business goals must move in sync.
The follow-up wasn’t just a clarification—it was an invitation to deepen the model. The AI explained how this structure supports agility: the CEO maintains oversight over technology direction, while the CTO leads execution, innovation, and cross-functional coordination. It even provided a real-world scenario—pivoting toward AI-driven automation—demonstrating how the reporting chain enables swift, unified action.
Decoding the Structure: Why This Design Works
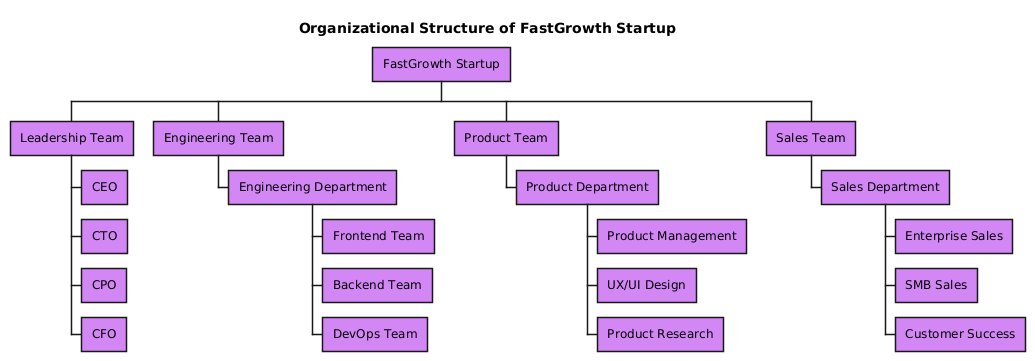
The generated organization chart follows a top-down hierarchical model, using a WBS (Work Breakdown Structure) notation to clearly represent reporting lines and team ownership. Here’s how each layer contributes:
- FastGrowth Startup: The root node, representing the company as a whole.
- Leadership Team: Central decision-makers—CEO, CTO, CPO, and CFO—each with direct accountability to the CEO.
- Engineering Team: Organized into frontend, backend, and DevOps, reflecting specialization while enabling collaboration.
- Product Team: Split into product management, UX/UI design, and research—ensuring end-to-end ownership of the user experience and innovation pipeline.
- Sales Team: Segmented into enterprise, SMB, and customer success, allowing tailored go-to-market strategies and post-sale engagement.
The use of PlantUML with custom styling (e.g., BackgroundColor #D287F5) ensures visual clarity and brand alignment. The structure avoids unnecessary complexity—no redundant layers, no overlapping roles—making it ideal for onboarding, investor presentations, or internal alignment.
Conversational Intelligence in Action
What sets Visual Paradigm apart is not just the diagram output, but the depth of insight the AI provides during the conversation. The ability to ask follow-up questions—like “Explain this branch” or “Refine the logic”—transforms the tool into a collaborative modeling partner.
The chat history shows how the AI responded not just with answers, but with contextual reasoning. For example, it didn’t just state that the CTO reports to the CEO—it explained why this matters: in fast-growth startups, centralized tech leadership prevents silos, maintains strategic focus, and enables rapid pivoting.
These insights are not generic. They reflect an understanding of startup dynamics, leadership psychology, and organizational scalability—something only an AI trained on real-world enterprise architecture patterns can deliver.
Beyond Organization Charts: A Full-Spectrum Modeling Platform
While this example focuses on an organization chart, the Visual Paradigm AI Chatbot is not limited to one diagram type. It supports a full suite of modeling standards, including:
- UML: For software design and system behavior modeling.
- ArchiMate: For enterprise architecture, linking business, application, and technology layers.
- SysML: For systems engineering, including requirements, behavior, and structure modeling.
- C4 Model: For software architecture visualization, from context to containers and components.
- Mind Maps, PERT Charts, SWOT, PEST, and Data Charts: For strategic planning, project management, and business analysis.
This versatility means that whether you’re designing a product roadmap, modeling a new business process, or visualizing a technology stack, the same AI assistant adapts to your needs—offering consistent, intelligent support across domains.
Conclusion: Build Faster, Think Smarter
Creating an effective organizational structure for a fast-growing startup isn’t just about drawing boxes and lines. It’s about understanding leadership dynamics, team ownership, and strategic alignment. With Visual Paradigm’s AI Chatbot, this process becomes a dialogue—where every question leads to deeper clarity, and every iteration builds a more resilient organization.
Ready to model your next growth phase? Explore the shared session and see how the AI Chatbot transforms your ideas into structured, intelligent models—crafted using the Visual Paradigm AI Chatbot.