


Designing Google’s Innovation Architecture: An AI-Powered Organizational Blueprint
Creating a realistic, scalable organization chart for a global tech giant like Google isn’t just about listing departments—it’s about capturing the flow of innovation, leadership, and operational synergy. The challenge lies in balancing hierarchical clarity with the dynamic, cross-functional nature of modern tech enterprises. This is where the Visual Paradigm AI Chatbot transforms the process from diagramming into collaborative design.
From Prompt to Precision: The Interactive Journey
The journey began with a simple request: “Generate an organization chart that shows the leadership and departmental structure of a large technology company like Google.” The AI Chatbot responded not with a static image, but with a living PlantUML script—a structured, expandable representation of Google’s organizational hierarchy.
When the user asked, “Explain this diagram,” the AI didn’t just describe nodes—it contextualized the structure, explaining how each branch reflects real-world roles: from engineering teams building Android and Chrome to research arms driving AI breakthroughs. This wasn’t a one-way output; it was a dialogue.
Further requests like “Refine the logic” or “Explain this branch” triggered deeper layers of insight. For example, the AI clarified that Google Brain and Google Cloud AI are not just teams—they’re strategic leadership hubs that influence product direction across the company. Each follow-up refined the model, adding nuance to how research, product, and operations interlock.
Decoding the Logic: Why This Structure Works
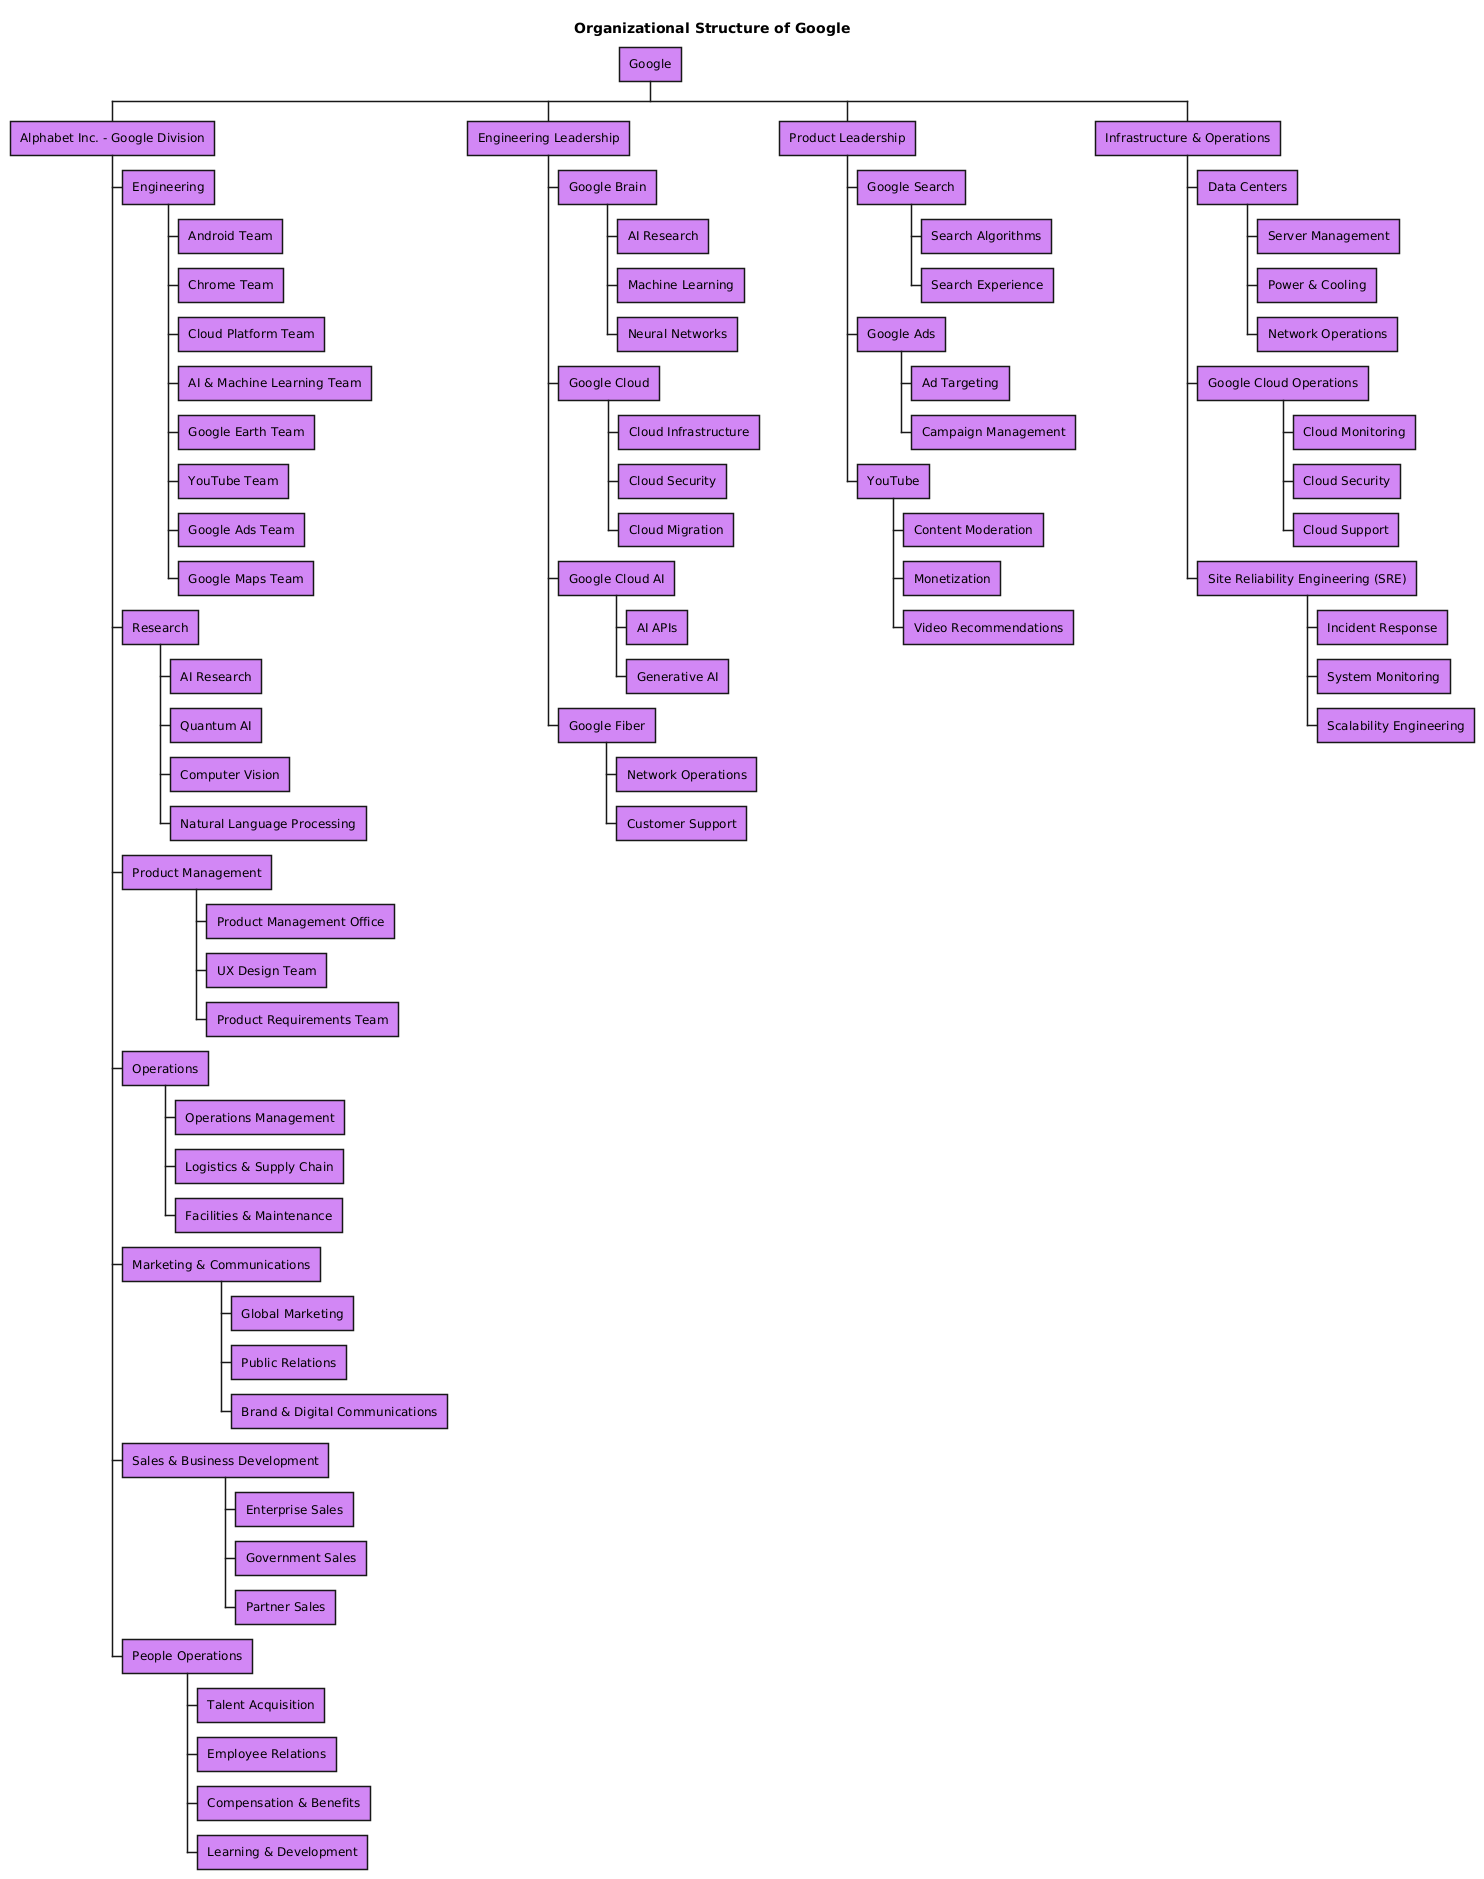
The diagram uses a Work Breakdown Structure (WBS) format in PlantUML, a choice that enables both clarity and scalability. Here’s how the hierarchy reflects Google’s real-world dynamics:
1. Parent-Child Relationship: Alphabet Inc. as the Holding Entity
At the top, Google is nested under Alphabet Inc., accurately reflecting its corporate parentage. This isn’t just a visual detail—it signals governance and strategic alignment across subsidiaries.
2. Core Pillars of Innovation
- Engineering: Houses product-centric teams like Android, Chrome, and Google Maps—each with dedicated leadership.
- Research: Focuses on long-term breakthroughs in AI, quantum computing, and computer vision—key to Google’s R&D edge.
- Product Management: Ensures user-centric design and alignment with business goals, bridging engineering and market needs.
3. Support & Enablement Functions
- People Operations: Manages talent acquisition, learning, and retention—critical in a competitive tech landscape.
- Marketing & Communications: Drives global brand presence and digital outreach.
- Sales & Business Development: Focuses on enterprise, government, and partner engagement.
4. Infrastructure & Reliability Leadership
The Infrastructure & Operations layer highlights how Google maintains its global scale:
- Site Reliability Engineering (SRE): Ensures system uptime and resilience.
- Data Centers: Manages power, cooling, and server operations at scale.
- Cloud Operations: Supports the reliability and security of Google Cloud.
This structure isn’t arbitrary—it mirrors how large tech firms organize for speed, scalability, and innovation. The AI Chatbot didn’t guess; it mapped known industry patterns into a coherent, professional visual.
Conversational Intelligence in Action
What sets Visual Paradigm apart is the AI Chatbot’s ability to function as a modeling consultant. Every user query—whether clarifying a branch or requesting a deeper explanation—was met with precise, context-aware responses. The AI didn’t just generate a diagram; it explained its logic, identified potential gaps, and suggested enhancements.
For instance, when the user asked to explain the Google Cloud AI team, the AI didn’t just list components—it highlighted how this team bridges research (e.g., generative AI) with product delivery (e.g., AI APIs), showing how innovation translates into service.
This level of insight isn’t automation—it’s AI-driven expertise, grounded in real-world enterprise architecture principles.

More Than Just an Org Chart: A Full Visual Modeling Suite
While this example focuses on an Organization Chart, the Visual Paradigm AI Chatbot is built to handle a full spectrum of visual modeling standards:
- UML: For software design and system architecture.
- ArchiMate: For enterprise architecture, mapping business, application, and technology layers.
- SysML: For complex system engineering and requirements modeling.
- C4 Model: For software architecture visualization at different abstraction levels.
- SWOT, PEST, Mind Maps, PERT Charts, Org Charts: For strategy, planning, and project management.
Whether you’re designing a cloud migration strategy with ArchiMate, modeling a new product’s lifecycle with SysML, or visualizing a team’s workflow with a PERT chart, the AI Chatbot adapts to your needs—always with the same depth of insight.
Conclusion: Where Vision Meets Execution
Creating a professional organization chart for a tech giant like Google isn’t about copying a template—it’s about understanding the interplay of leadership, innovation, and execution. With Visual Paradigm’s AI Chatbot, that process becomes a collaborative, intelligent journey.
From the initial prompt to the final explanation, the AI didn’t just generate a diagram—it guided the design, clarified the logic, and delivered a model ready for internal use, onboarding, or strategic planning.
Ready to build your own AI-powered organizational blueprint? Explore the live session and see how the AI Chatbot transforms ideas into precision models—no coding, no guesswork.