


Designing a Pharmaceutical Innovation Ecosystem: An AI-Powered Organizational Blueprint
Creating a clear, accurate organizational structure for a pharmaceutical company involves more than listing departments—it demands precision in how research, regulatory, manufacturing, and sales functions interlock. With the complexity of drug development cycles and strict compliance requirements, even small misalignments can delay timelines or compromise safety. That’s where the Visual Paradigm AI Chatbot steps in—not as a diagram generator, but as a collaborative modeling partner.

From Concept to Clarity: A Conversational Design Journey
The journey began with a simple request: “Draw an organization chart to explain the research, regulatory, manufacturing, and sales teams of a pharmaceutical company.” The AI Chatbot immediately responded with a structured PlantUML WBS (Work Breakdown Structure) format, which Visual Paradigm translates into a clean, professional organization chart. But this wasn’t a static output—it was the start of a dynamic dialogue.
After reviewing the initial structure, the user asked: “Can you explain the role of the Preclinical Development Team in the drug development process?” The AI didn’t just restate the diagram’s label. Instead, it delivered a detailed, context-rich explanation that mapped the team’s responsibilities to real-world stages of drug development—highlighting in vitro and in vivo testing, pharmacokinetics, and the critical role in supporting IND filings.
When the user followed up with “Explain this branch” referring to the Preclinical Development sub-teams, the AI refined its response with a tiered breakdown of responsibilities and their strategic impact on downstream clinical trials. This iterative exchange—where each question deepened the understanding of both structure and function—illustrates how the AI Chatbot functions as a modeling consultant, not just a tool.
Visualizing the PharmaAdvantage Ecosystem
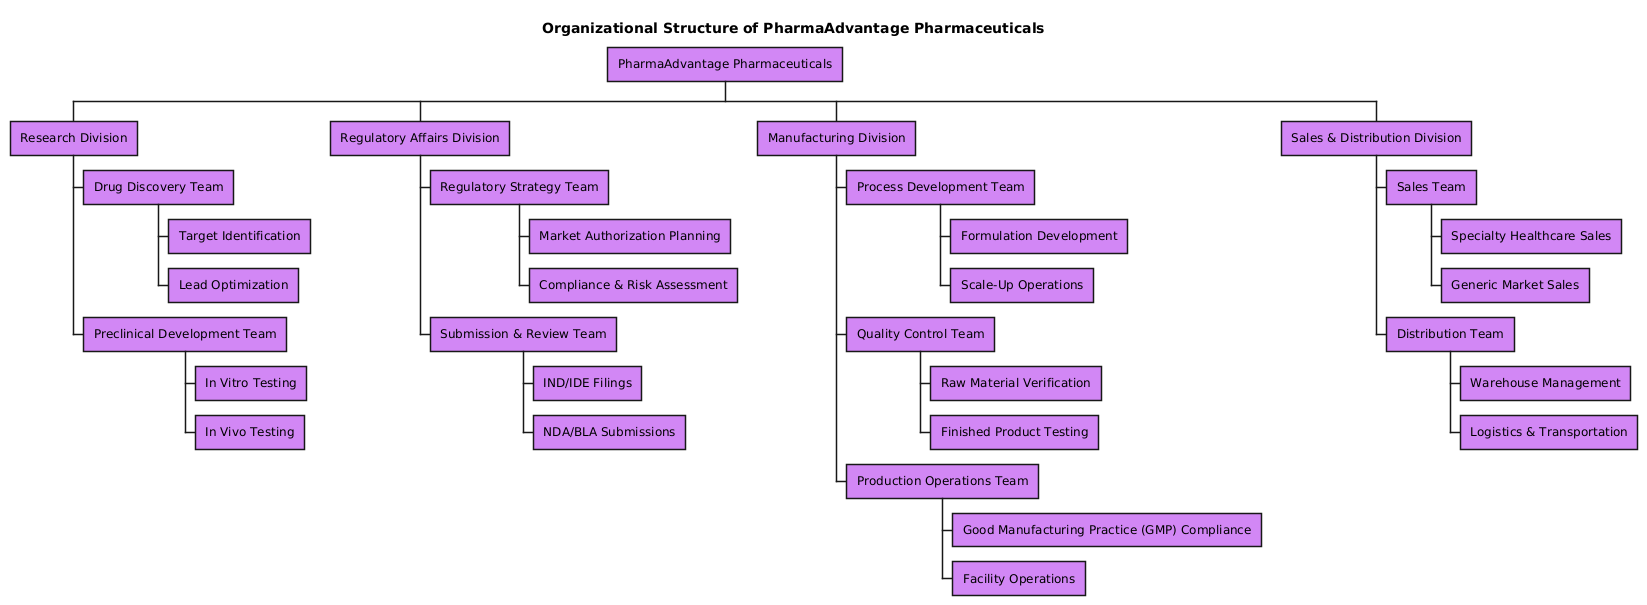
The final organization chart reflects a well-architected pharmaceutical enterprise, with four core divisions: Research, Regulatory Affairs, Manufacturing, and Sales & Distribution. Each division is further decomposed into specialized teams, ensuring accountability and clarity across the drug lifecycle.
Decoding the Logic: Why This Structure Works
The design follows a hierarchical WBS (Work Breakdown Structure) model, which is ideal for organizational charts because it:
- Maps function to phase: The Research Division is structured around the drug development pipeline—from target identification to preclinical validation.
- Aligns with regulatory timelines: The Regulatory Affairs Division is split into Strategy and Submission teams, mirroring the two key phases before clinical trials (IND) and market approval (NDA/BLA).
- Embeds compliance at every level: Manufacturing includes GMP compliance and quality control, reinforcing that safety is not an afterthought but a core function.
- Supports commercial readiness: The Sales & Distribution team is divided by market segment (specialty vs. generic), ensuring tailored go-to-market strategies.
The use of PlantUML syntax isn’t arbitrary—it’s a powerful, human-readable language that enables the AI to generate consistent, scalable diagrams. The visual style—consistent color coding (purple for leadership, soft gradients for team levels)—enhances readability and aligns with enterprise design standards.
Conversational Intelligence in Action
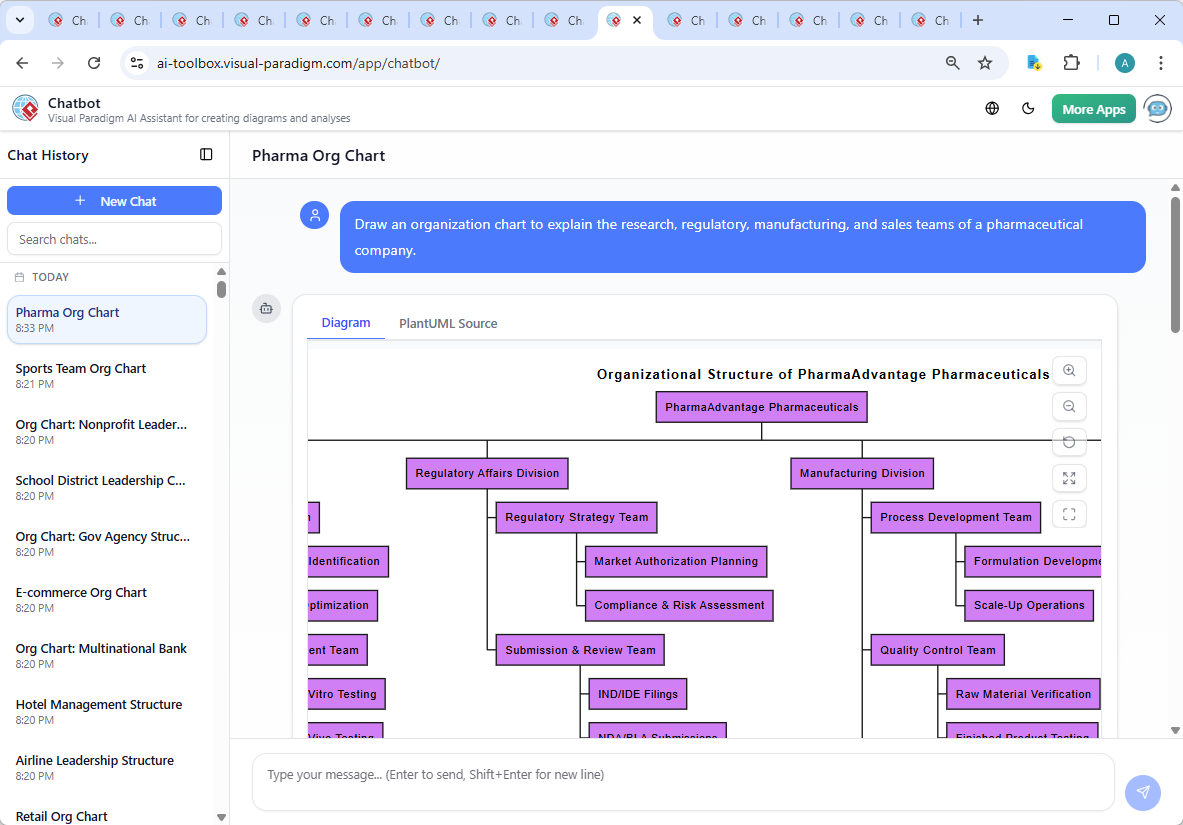
What sets this process apart is the depth of interaction. The chat history shows a true collaboration: the user posed a question, the AI responded with domain-specific insight, and the user then prompted further clarification. This isn’t a one-way diagram generation—it’s a dialogue where each exchange improves the model’s fidelity.
For instance, when the user asked to “refine the logic” behind the Preclinical Development branch, the AI didn’t just rephrase—it contextualized the team’s role in risk mitigation and regulatory strategy. This kind of expert-level reasoning is what makes the Visual Paradigm AI Chatbot a true modeling partner.
Beyond Organization Charts: A Full Modeling Suite
While this example focuses on an organization chart, the Visual Paradigm AI Chatbot is not limited to a single diagram type. It seamlessly supports:
- UML (for system design and software modeling)
- ArchiMate (for enterprise architecture and business-IT alignment)
- SysML (for systems engineering and complex product development)
- C4 Model (for software architecture visualization)
- Mind Maps, PERT Charts, SWOT, PEST, and data visualization (e.g., column, pie, line charts)
Whether you’re mapping business strategy, designing a medical device system, or aligning IT with compliance, the AI Chatbot adapts to your standard of choice—making Visual Paradigm a unified platform for all visual modeling needs.
Conclusion: Build Smarter, Faster, Together
The pharmaceutical industry demands precision, speed, and clarity. With Visual Paradigm’s AI Chatbot, teams can transform abstract ideas into structured, intelligent models through natural conversation. The result? A fully annotated, compliant, and scalable organization chart—not just a diagram, but a living blueprint for innovation.
Ready to design your next enterprise model with AI intelligence? Start your session now and experience the future of visual modeling.