

Designing the Future of Social Media: An AI-Driven Organization Chart for SocialConnect Inc.
Building a scalable, agile organization for a fast-moving social media company requires more than just a static chart—it demands clarity, foresight, and adaptability. Traditional diagramming tools often fall short when teams need to rapidly iterate on structure, align roles with product strategy, or map complex interdependencies. Enter the Visual Paradigm AI Chatbot: not just a diagram generator, but a collaborative modeling partner that turns high-level vision into precise, actionable organizational blueprints.
From Concept to Clarity: A Collaborative Design Journey
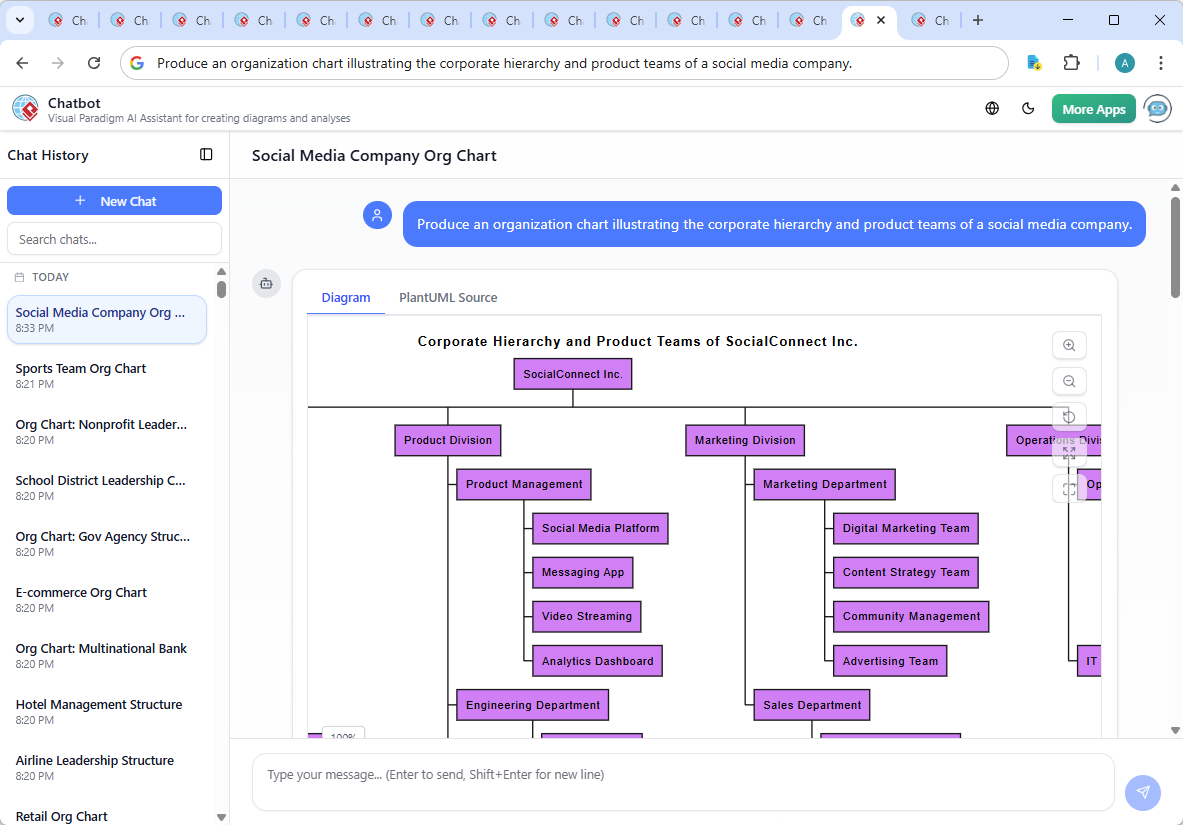
The journey began with a simple prompt: “Produce an organization chart illustrating the corporate hierarchy and product teams of a social media company.” Within seconds, the Visual Paradigm AI Chatbot delivered a fully structured WBS-style organization chart in PlantUML syntax, complete with logical groupings and role-level detail. But the real value emerged in the conversation that followed.
After reviewing the initial output, the user asked: “What specific tasks does the DevOps & Cloud team handle within the Engineering Department?” This wasn’t a request for a diagram—it was a demand for context, for depth. The AI responded not with a list, but with a layered breakdown of responsibilities, including infrastructure automation, CI/CD pipelines, security compliance, and real-time monitoring—each tied to the operational needs of a high-traffic platform.
When the user followed up with “AI, refine the logic” to clarify the reporting structure between Product Management and Engineering, the chatbot adjusted the hierarchy to reflect cross-functional alignment—ensuring that product goals and engineering execution are tightly coupled. These iterative exchanges demonstrate the AI Chatbot’s role as a modeling consultant, not just a rendering engine.
Decoding the Structure: Why This Organization Chart Works
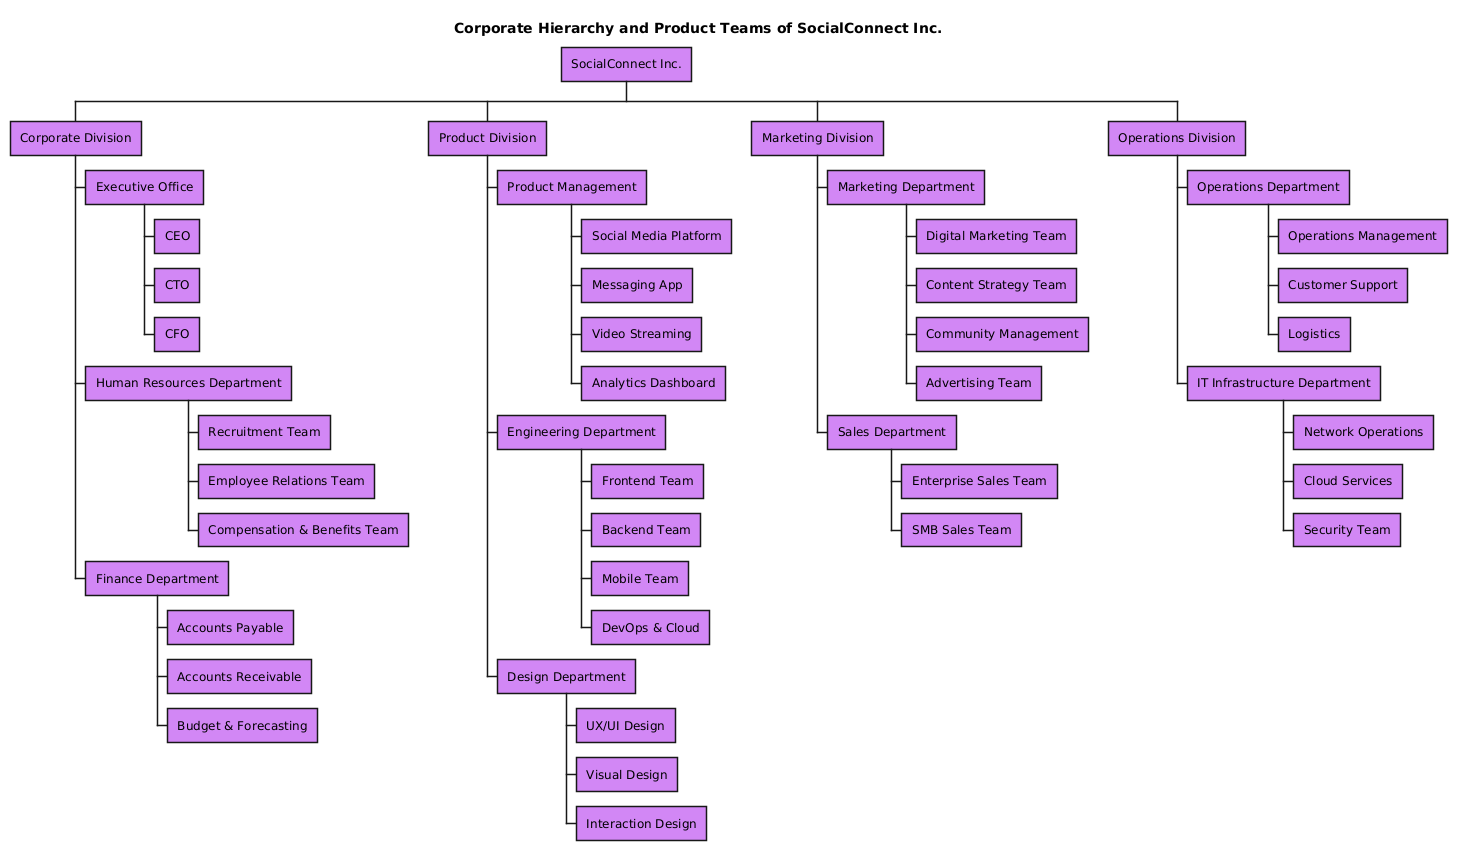
The final organization chart reflects a modern, product-led enterprise structure. At its core is a Corporate Division housing executive leadership and support functions like Finance and HR—essential for governance and stability. The Product Division is the innovation engine, with clear ownership over key platforms: the Social Media Platform, Messaging App, Video Streaming, and Analytics Dashboard.
Under Product Management, each product line has dedicated teams, but the real strength lies in the Engineering Department, which is split into specialized units: Frontend, Backend, Mobile, and DevOps & Cloud. This reflects the industry standard of feature-focused, cross-functional squads, enabling faster delivery and better accountability.
The Design Department ensures user-centricity across all products, while the Marketing and Sales Division drives growth through digital campaigns, content strategy, and customer acquisition. Finally, the Operations Division ensures resilience—through customer support, IT infrastructure, and security—keeping the platform live and secure at scale.
The use of PlantUML’s @startwbs syntax wasn’t arbitrary. It allowed for hierarchical nesting, visual clarity, and machine-readable structure—ideal for both human review and integration into documentation or CI/CD workflows.
Conversational Intelligence in Action
What sets Visual Paradigm apart is how seamlessly the AI Chatbot integrates feedback into the design process. After the initial chart was generated, the user didn’t just accept the output—they questioned it. The AI responded with expert-level explanations, turning a static diagram into a living knowledge base.
For example, when asked to explain the DevOps & Cloud team’s role, the AI didn’t just list tasks—it contextualized them: how CI/CD pipelines reduce deployment risk, how monitoring enables real-time incident response, and how cost optimization supports sustainable growth. These insights aren’t boilerplate; they reflect deep domain expertise in modern software delivery.
Even subtle requests like “Show me the reporting lines” or “Highlight cross-team dependencies” were addressed through iterative refinement, proving the AI’s ability to act as a strategic design collaborator.
More Than Just Org Charts: A Full AI-Powered Modeling Suite
The Visual Paradigm AI Chatbot isn’t limited to organization charts. It’s a multi-standard modeling engine capable of generating UML diagrams, ArchiMate for enterprise architecture, SysML for systems engineering, C4 Model for software architecture, and even visual tools like mind maps, PERT charts, SWOT analysis, and interactive data visualizations (e.g., column, pie, line charts).
This versatility means teams can use a single platform for everything from high-level strategy to technical design. Whether you’re mapping the flow of a digital transformation (ArchiMate), modeling system behavior (SysML), or visualizing team dynamics (Mind Maps), the AI Chatbot adapts to your needs—always with the same level of precision and conversational intelligence.
Empower Your Team with AI-Powered Clarity
Creating an organization chart isn’t just about drawing boxes and lines. It’s about aligning people, processes, and products in a way that supports growth, agility, and innovation. With the Visual Paradigm AI Chatbot, that process becomes dynamic, collaborative, and deeply insightful.
Whether you’re restructuring a startup, scaling a product team, or visualizing enterprise architecture, the platform delivers more than diagrams—it delivers clarity, context, and confidence.