

Designing a Scalable Software Development Organization with AI-Powered Precision
Building a clear, effective organizational structure for a software development team is more than just assigning titles—it’s about aligning roles, responsibilities, and reporting lines to deliver value efficiently. Traditional approaches often rely on static templates or manual diagramming, which can lead to ambiguity, misalignment, and slow iteration. Enter the Visual Paradigm AI Chatbot: a conversational modeling expert that transforms abstract ideas into structured, intelligent organization charts—crafted in real time through natural dialogue.
From Idea to Insight: A Collaborative Modeling Journey
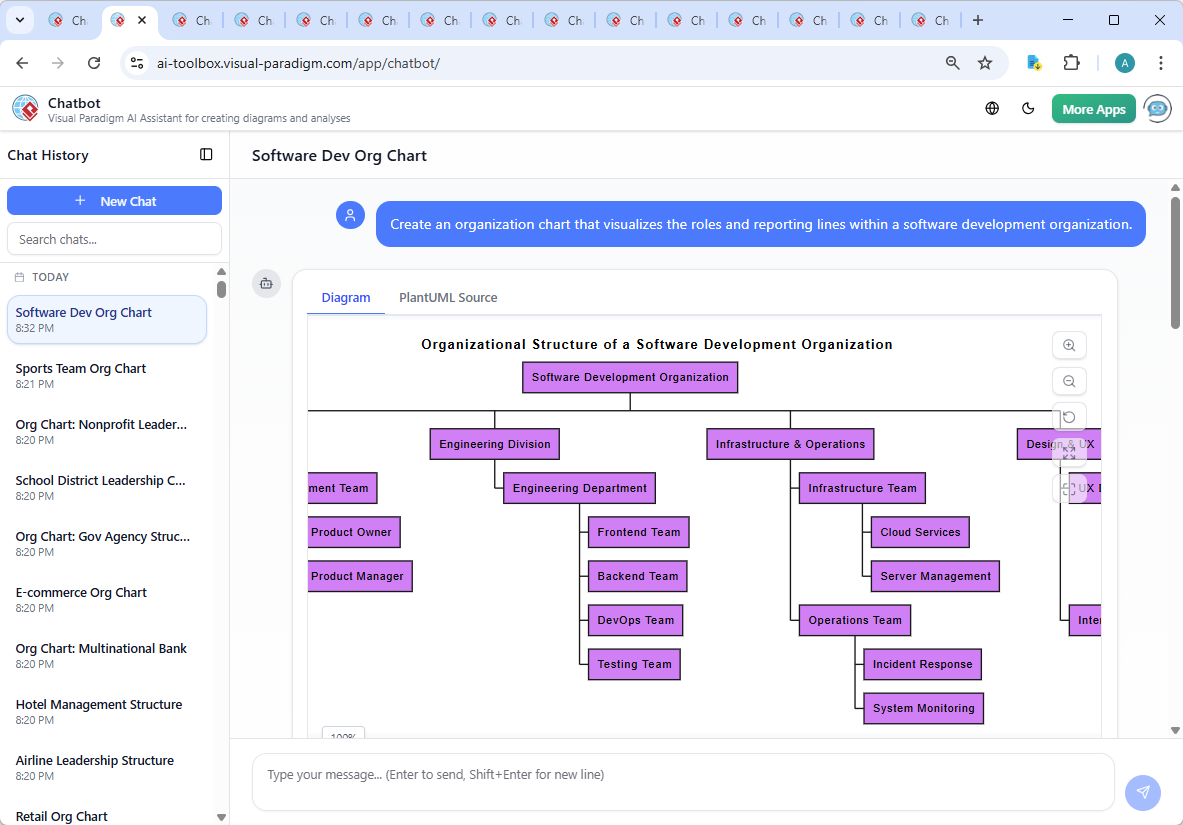
The process began with a simple prompt: “Create an organization chart that visualizes the roles and reporting lines within a software development organization.” Within seconds, the Visual Paradigm AI Chatbot responded with a structured WBS-style diagram using PlantUML syntax, already reflecting a clear division of responsibilities across key domains—Product Management, Engineering, Infrastructure, and Design.
But the real power emerged in the conversation. When asked to explain the role of the Product Owner, the AI didn’t just define the title—it provided a detailed breakdown of responsibilities, including backlog prioritization, stakeholder communication, and alignment with business goals. This wasn’t a static definition; it was a modeling consultation, revealing how each role contributes to the broader product lifecycle.
Further refinement followed: “Can you explain the responsibilities of the Product Owner within the Product Management Team?” The AI delivered a comprehensive, tiered explanation—highlighting strategic vision, customer advocacy, and decision-making authority—while anchoring each point in agile best practices. This back-and-forth wasn’t just documentation; it was iterative design, where every clarification strengthened the organizational logic.
Visualizing the Structure
Decoding the Logic Behind the Diagram
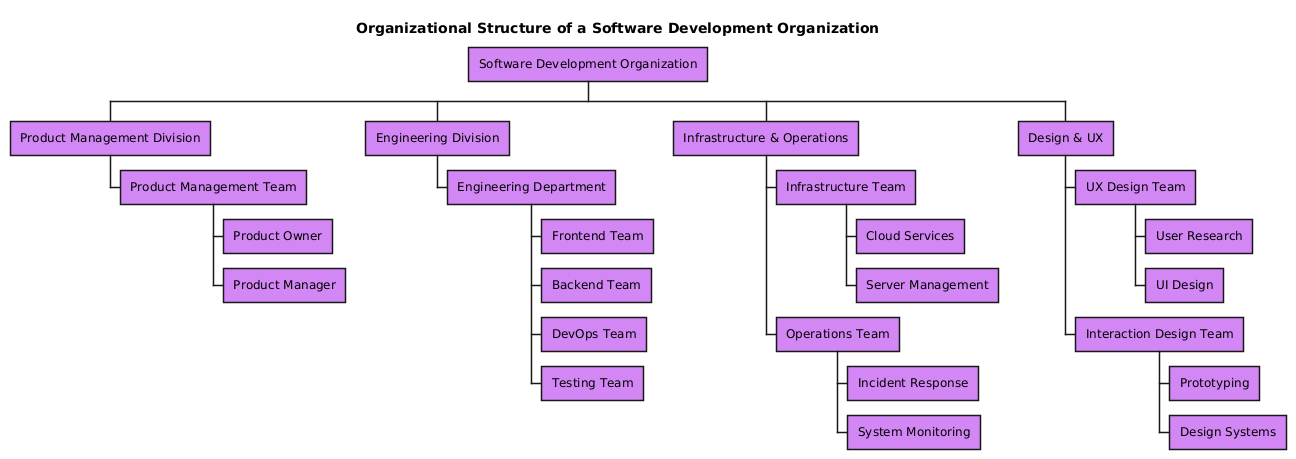
The resulting organization chart is built on a hierarchical WBS (Work Breakdown Structure) model, chosen for its clarity in representing reporting lines and functional divisions. Each node reflects a real-world role, and the structure mirrors how software organizations scale: from strategy to execution.
Key Structural Elements:
- Product Management Division: Anchors the product lifecycle, with the Product Owner and Product Manager working in tandem to define vision and roadmap.
- Engineering Division: Houses the core development teams—Frontend, Backend, DevOps, and Testing—each with specialized responsibilities that ensure quality, speed, and reliability.
- Infrastructure & Operations: Separates system reliability from development, ensuring that cloud services and incident response are managed independently for resilience.
- Design & UX: Highlights the importance of user-centered design, with dedicated teams for research, UI, and interaction design—critical for product usability and adoption.
By organizing teams into divisions, the chart supports both operational clarity and cross-functional collaboration. The use of PlantUML syntax enables seamless export and integration into documentation, while the visual hierarchy ensures that reporting lines are instantly recognizable.
Conversational Intelligence in Action
What sets this process apart is the depth of insight the AI provides beyond diagramming. The chat history reveals how the AI functions as a modeling consultant, not just a generator. When asked to clarify the Product Owner’s role, the AI didn’t default to a generic definition—it contextualized it within agile frameworks, emphasized its strategic weight, and highlighted its impact on delivery outcomes.
Each follow-up query was treated as a design refinement. Requests like “Explain this branch” or “Refine the logic” were met with precise, actionable insights—proving that the AI Chatbot isn’t just reactive, but proactive in shaping better models.
Beyond Organization Charts: A Full Modeling Suite
While this example focuses on an organization chart, the Visual Paradigm AI Chatbot is far more versatile. It supports multiple modeling standards, including UML for software design, ArchiMate for enterprise architecture, SysML for systems engineering, and C4 Model for software architecture visualization. Whether you’re mapping business processes, designing microservices, or modeling system behavior, the AI adapts to your domain.
This multi-standard capability makes Visual Paradigm not just a diagramming tool, but a unified AI-powered visual modeling platform—one that evolves with your organization’s complexity.
Empower Your Team with Smarter Design
Creating an effective software development organization chart isn’t about drawing boxes—it’s about modeling strategy, accountability, and flow. With Visual Paradigm’s AI Chatbot, you’re not just building a diagram; you’re co-creating a living blueprint for team alignment and performance.
Try it today and experience how natural conversation can shape intelligent, scalable organizational structures.