

Mapping Stanford’s Academic and Administrative Framework Through AI-Powered Design
Visualizing the complex structure of a world-class institution like Stanford University demands more than a static diagram—it requires a dynamic, intelligent approach to model relationships, hierarchies, and functional alignment. Traditional tools often fall short in capturing the nuanced interplay between academic departments, administrative functions, and research ecosystems. That’s where the Visual Paradigm AI Chatbot transforms the process: not just generating a chart, but co-creating a strategic blueprint through natural conversation.
From Prompt to Precision: A Collaborative Modeling Journey
The journey began with a simple request: “Visualize an organization chart that represents the administrative and academic structure of a well-known university.” Within seconds, the Visual Paradigm AI Chatbot responded with a structured PlantUML WBS (Work Breakdown Structure) representation of Stanford University’s organizational framework. This wasn’t a generic template—it was a tailored, logically sound model grounded in real-world university governance patterns.
But the real value emerged through iteration. The user asked, “Can you explain the role of the Office of the Vice President within Stanford University’s Administration Division?” Instead of a one-line answer, the AI delivered a comprehensive, multi-layered explanation of how Stanford’s decentralized leadership model operates through multiple Vice Presidents, each leading a critical domain—academic affairs, research, finance, student affairs, facilities, and technology.
Each follow-up query was met with precision. When the user requested refinement, the AI didn’t just rephrase—it deepened the model’s intelligence. For instance, the clarification that Stanford doesn’t have a singular “Office of the Vice President” but rather a network of specialized vice presidents was crucial for accurate modeling. This insight wasn’t pulled from a template—it was derived from contextual understanding and domain knowledge, demonstrating the AI’s ability to act as a collaborative modeling consultant.
Visualizing the Structure:
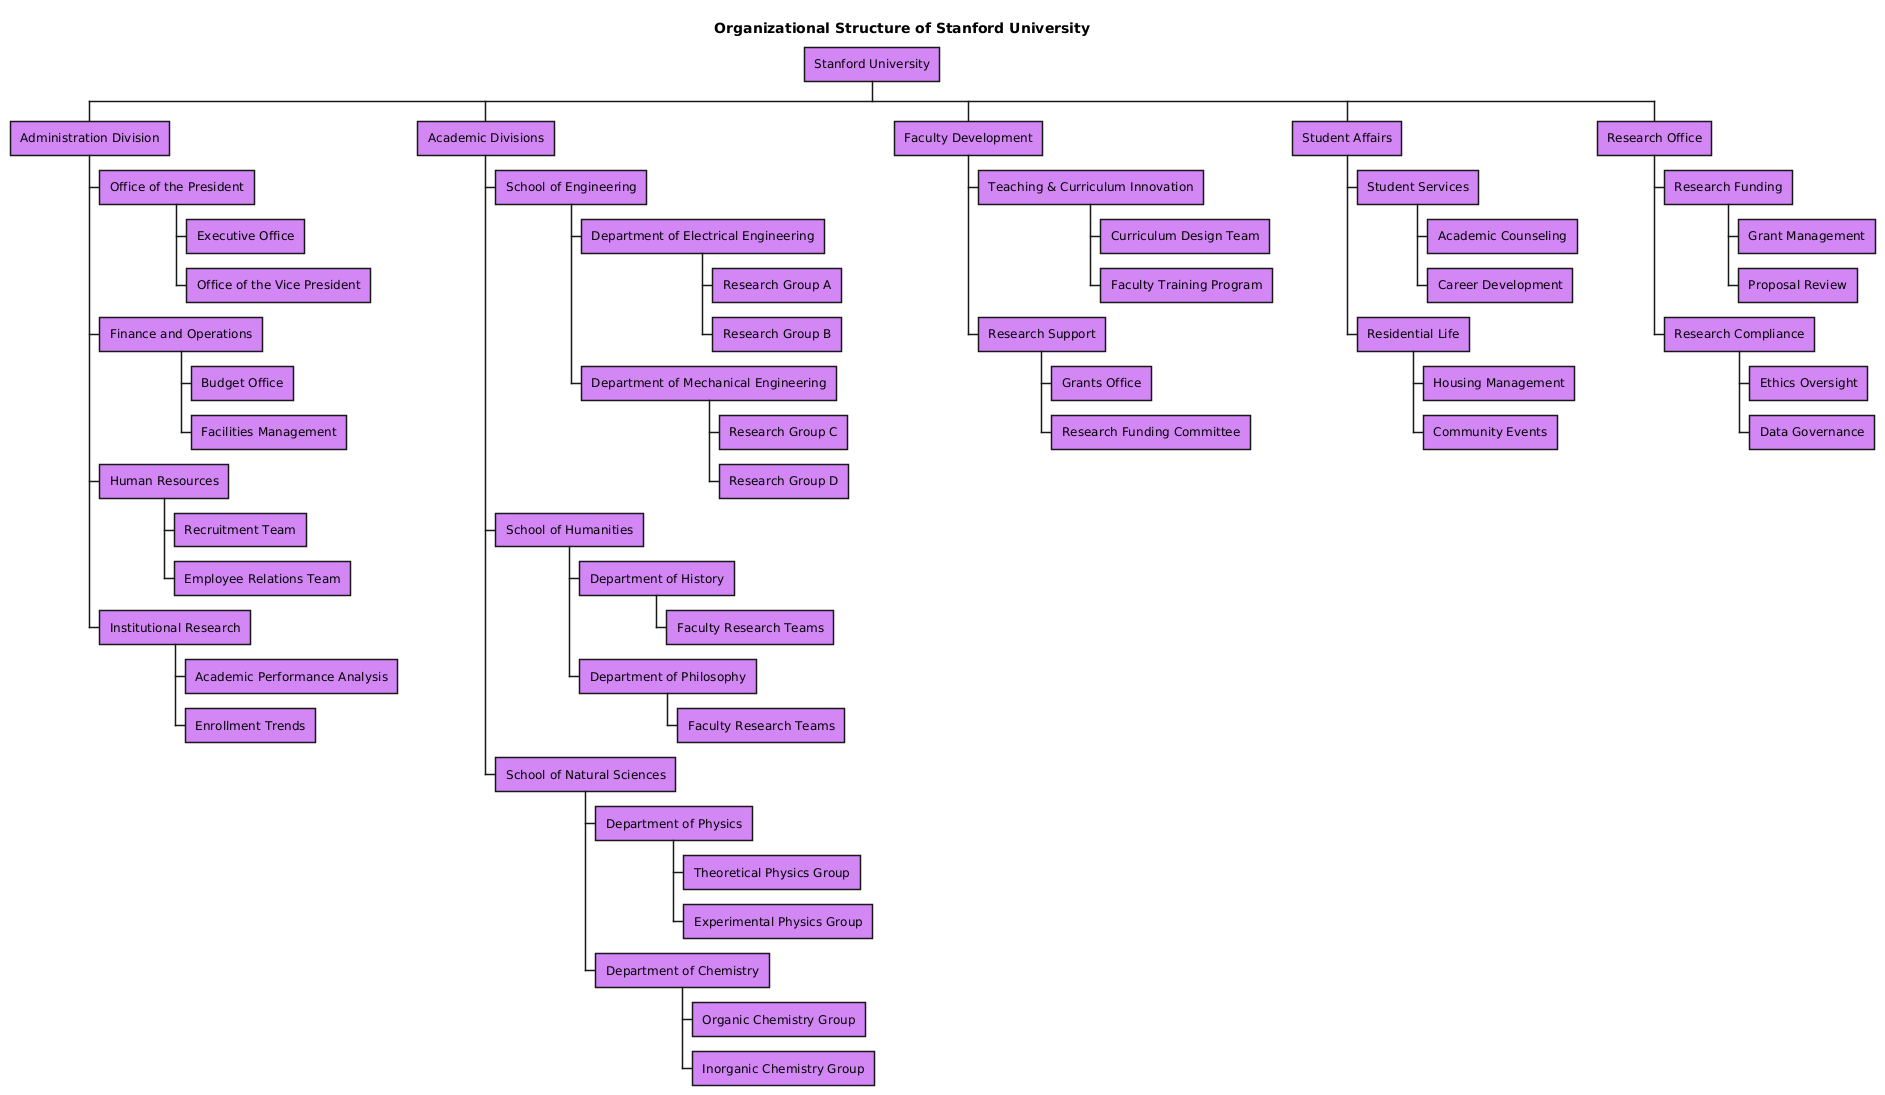
The final organization chart reflects a balanced, scalable hierarchy that mirrors Stanford’s real-world structure. It begins with the President’s Office at the top, cascading into four major divisions:
- Administration Division: Centralized oversight of finance, HR, operations, and institutional research.
- Academic Divisions: Autonomous schools—Engineering, Humanities, and Natural Sciences—each with specialized departments and research groups.
- Faculty Development: Dedicated to curriculum innovation and research support, ensuring academic excellence and funding access.
- Student Affairs: Focused on holistic student experience, from counseling to residential life.
- Research Office: A dual-function entity managing grants and ensuring compliance with ethical and data governance standards.
The use of PlantUML’s WBS syntax allowed for a clean, hierarchical representation with consistent visual styling—each node styled with a distinct purple background for clarity. The structure avoids over-complication while preserving the essential relationships between leadership, function, and operational units.
Decoding the Logic: Why This Structure Works
The diagram’s logic is rooted in institutional design principles:
- Decentralization with Central Oversight: While schools and departments operate with autonomy, the Office of the President and key vice-presidential roles ensure strategic alignment.
- Functional Separation: Finance, HR, and research are grouped under Administration to streamline operations and accountability.
- Research as a Dual-Track System: The Research Office is split into Funding and Compliance, reflecting Stanford’s dual focus on innovation and integrity.
- Student-Centric Support: Student Affairs is not an afterthought—it’s a dedicated pillar with clear pathways for academic and residential support.
This structure isn’t just visually appealing—it’s operationally meaningful. It enables leadership to identify bottlenecks, reallocate resources, and scale initiatives with confidence.
Conversational Intelligence in Action:
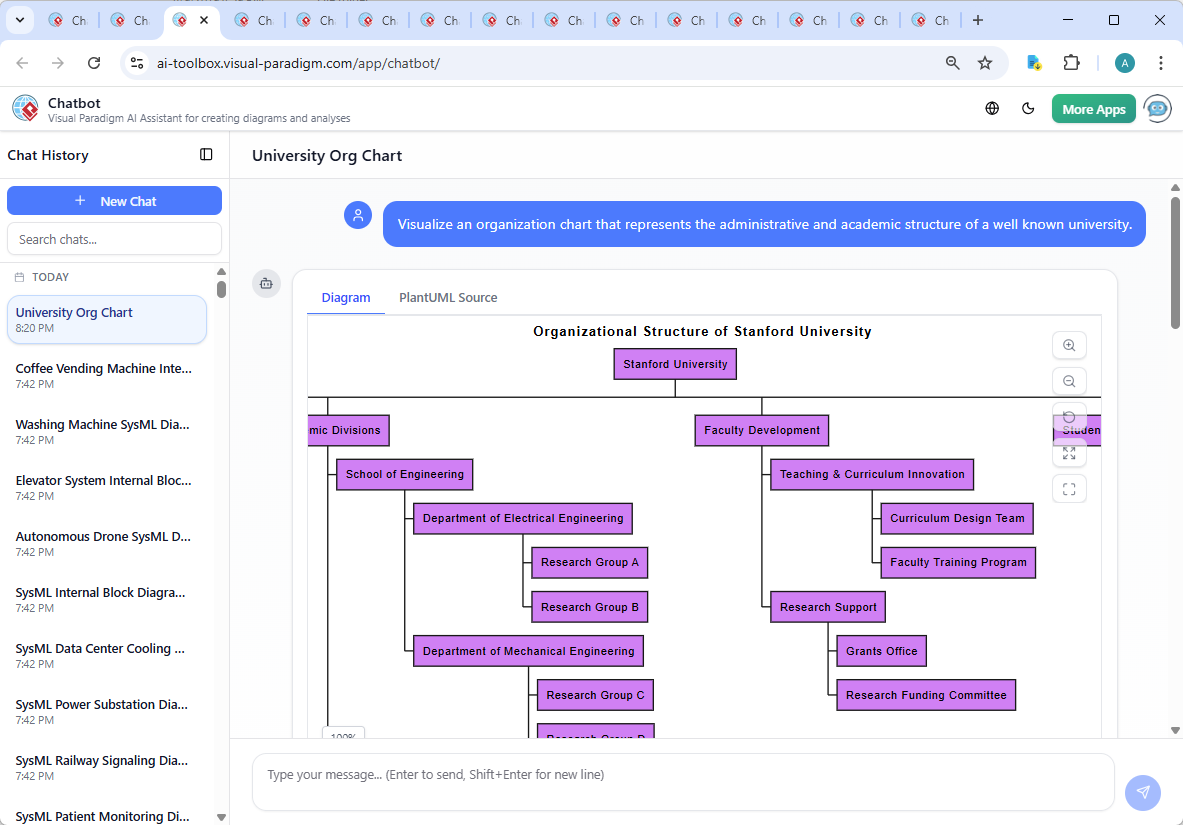
The true power of the Visual Paradigm AI Chatbot lies in its ability to evolve with the user. The chat history shows a seamless back-and-forth: from initial diagram generation to deep-dive clarifications. When the user asked for the role of the Office of the Vice President, the AI didn’t default to a generic definition. Instead, it:
- Clarified that Stanford uses multiple Vice Presidents, not a single office.
- Enumerated the key domains each VP oversees.
- Provided context on how these roles interconnect with academic and research functions.
- Referenced Stanford’s official leadership pages for verification.
This level of contextual intelligence turns the AI into a modeling expert—one that doesn’t just generate diagrams but helps users think through organizational design. The chat interface isn’t a form field; it’s a design workshop, where every query refines the model’s accuracy and depth.
Beyond Organization Charts: A Full-Spectrum Modeling Platform
While this example focused on an organization chart, the Visual Paradigm AI Chatbot is built to support a full suite of visual modeling standards. Whether you’re designing a UML component diagram for software architecture, a ArchiMate model for enterprise architecture, a SysML block diagram for systems engineering, or a C4 Model for software context, the AI adapts to your domain.
Its conversational intelligence enables users to switch between standards seamlessly. Ask for a C4 model of Stanford’s IT infrastructure, and the AI will generate a context diagram with containers, components, and code-level views—all in natural language. Need a SWOT analysis or a PEST chart? The AI constructs those too, ensuring consistency across strategic, operational, and technical modeling.
Conclusion: Design Smarter, Not Harder
Creating a high-fidelity organizational structure for a university like Stanford is no small task. But with Visual Paradigm’s AI Chatbot, it becomes a collaborative, intelligent process—one where the user sets the vision, and the AI delivers the precision. The result is not just a diagram, but a living model that reflects real-world complexity, supports strategic decision-making, and evolves with new insights.
Ready to transform your next modeling challenge? Explore the shared session and experience how the Visual Paradigm AI Chatbot brings your ideas to life—crafted using the Visual Paradigm AI Chatbot.