


Mapping the Blueprint of an Airport Terminal: An AI-Driven PERT Chart Journey
Constructing a new airport terminal is one of the most complex infrastructure undertakings—requiring precise coordination across planning, construction, and operational readiness. The challenge lies not just in executing tasks, but in understanding how each step depends on the last. That’s where the Visual Paradigm AI Chatbot steps in—not as a passive diagram generator, but as a collaborative modeling expert.
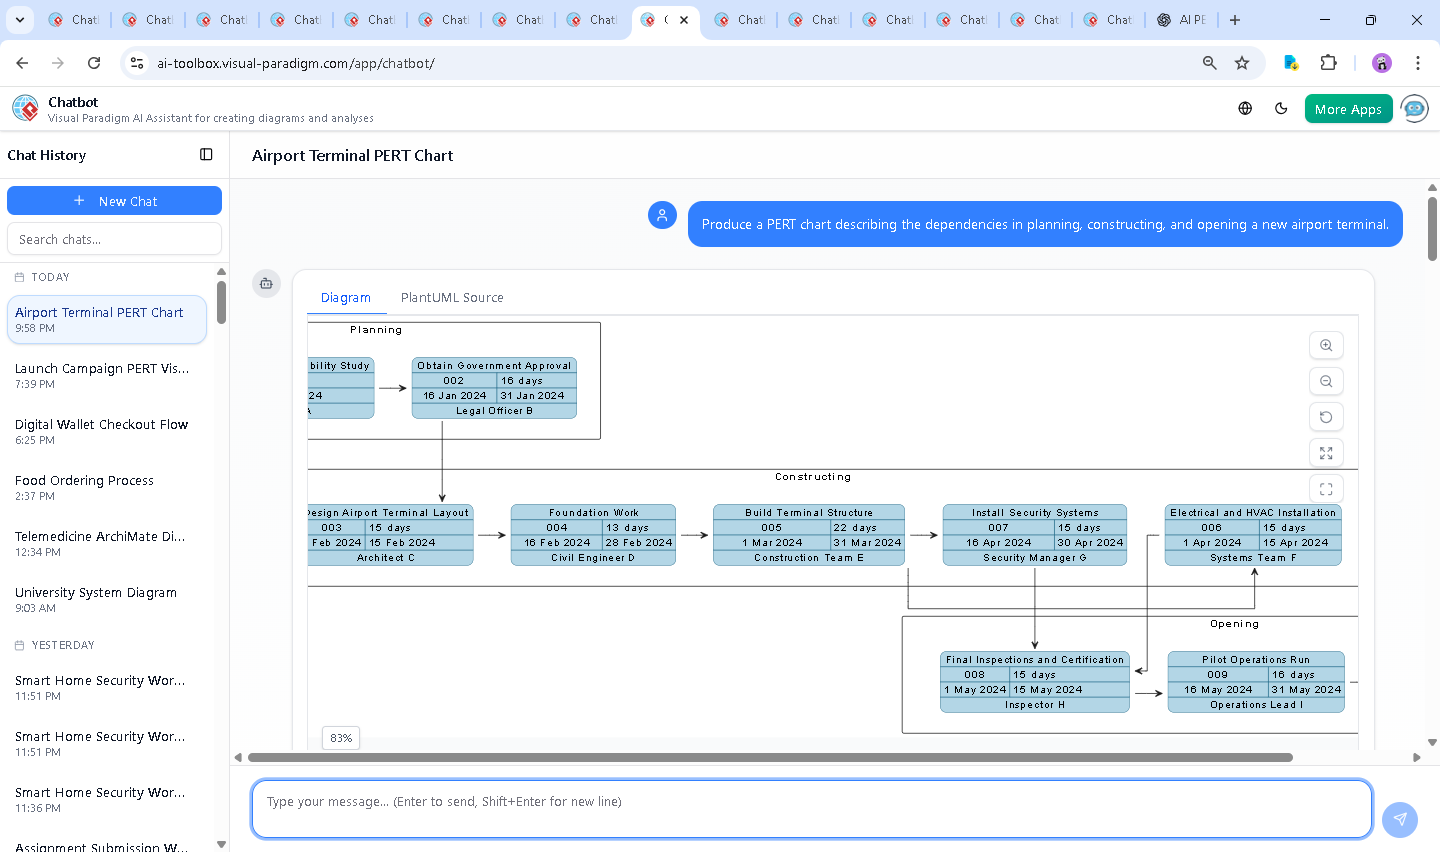
When the user asked for a PERT chart outlining the dependencies in planning, constructing, and opening a new airport terminal, the AI didn’t just generate a static diagram. It initiated a conversational design process—interpreting intent, structuring tasks logically, and refining the workflow through iterative feedback.
From Idea to Insight: The Interactive Journey of a PERT Chart
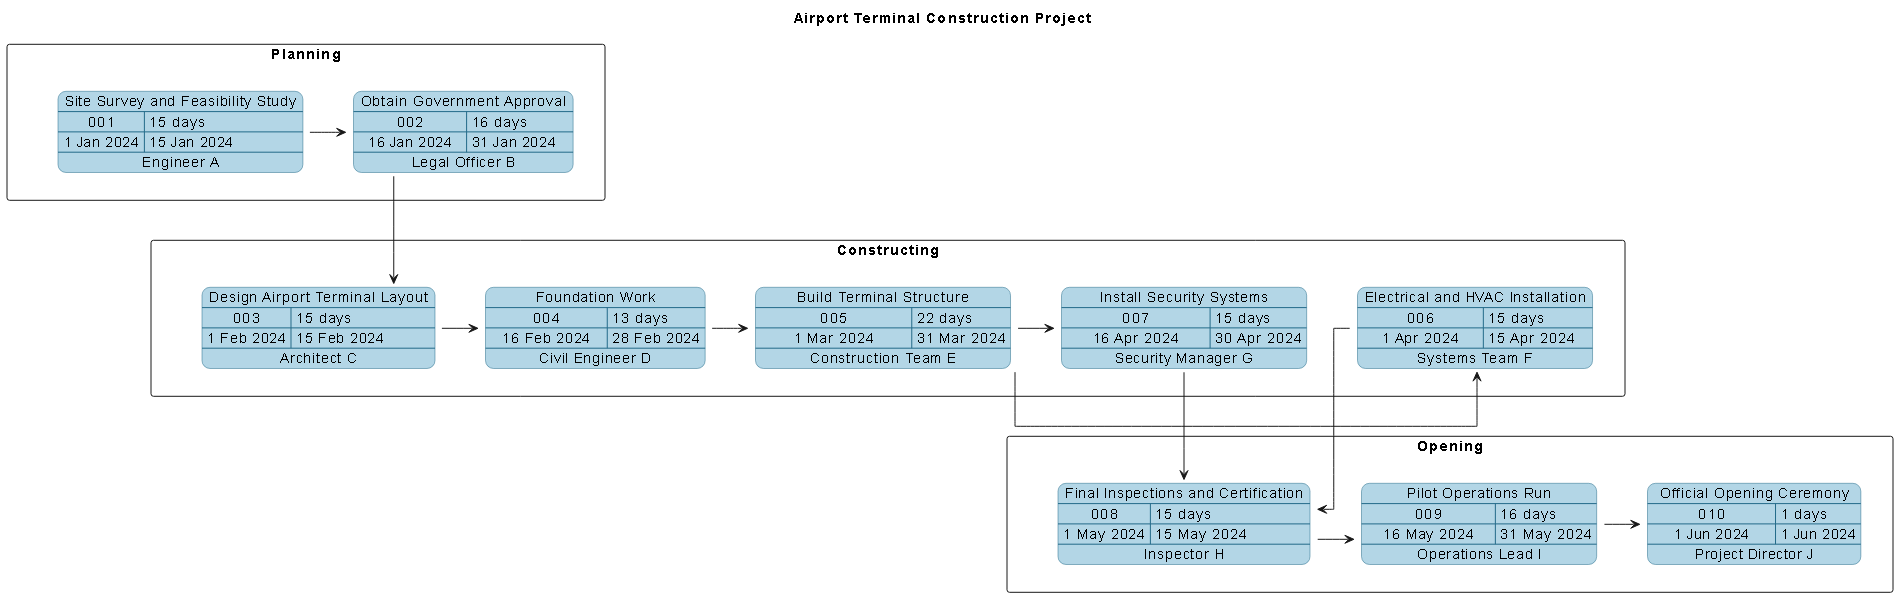
The conversation began with a clear directive: “Produce a PERT chart describing the dependencies in planning, constructing, and opening a new airport terminal.” Within seconds, the AI delivered a fully rendered PERT chart using PlantUML syntax, already structured into three lanes—Planning, Constructing, and Opening—each with realistic task timelines, responsible roles, and dependency links.
But the real value emerged in the follow-up. When the user said, “Explain this diagram,” the AI didn’t just list tasks. It provided a layered breakdown:
- It clarified the critical path—the sequence of tasks that dictates the project’s total duration.
- It highlighted parallel dependencies, such as electrical and security systems, which can run concurrently after the structure is complete.
- It explained the timing logic, showing why government approval must precede design, and why final inspections depend on both systems being completed.
This wasn’t a one-way output. The AI responded to queries with the precision of a project architect—adjusting explanations based on context, offering risk insights, and even suggesting additional analysis options like Gantt charts or cost modeling.
Decoding the PERT Chart Logic: Why This Structure Works
The PERT chart was built using PlantUML’s PERT chart syntax, a powerful yet accessible format that Visual Paradigm supports natively. Here’s how the logic was constructed:
- Task Grouping by Phase: Tasks were organized into lanes—Planning, Constructing, and Opening—ensuring visual clarity and phase-based accountability.
- Realistic Timelines: Each task was assigned a start date, finish date, and duration in days, reflecting real-world project pacing (e.g., 15 days for site survey, 22 for structure).
- Dependency Mapping: The
$dependency()function was used to define task sequences. For example:$dependency(task01, task02)→ Site survey must finish before government approval begins.$dependency(task05, task06)→ Structure must be complete before electrical systems are installed.$dependency(task06, task08)and$dependency(task07, task08)→ Both systems must finish before final inspections.
- Critical Path Identification: The AI implicitly calculated the longest path—Site Survey → Government Approval → Design → Foundation → Structure → Electrical & HVAC → Security → Final Inspections → Pilot Operations → Official Opening—totaling ~160 days.
This structure ensures that project managers can identify bottlenecks early and allocate resources accordingly. The choice of PERT over Gantt, for example, emphasizes task relationships over rigid timelines—ideal for early-stage planning and risk assessment.
Conversational Intelligence: The AI Chatbot as a Modeling Consultant
What sets Visual Paradigm apart is not just the output, but the intelligence behind the conversation. The AI didn’t just accept the prompt—it engaged in a design dialogue, refining the model based on user feedback.
When the user asked for an explanation, the AI didn’t default to a technical glossary. Instead, it:
- Structured the response around project phases.
- Highlighted dependencies with visual cues (→) and contextual notes.
- Provided actionable insights: e.g., “Design is a bottleneck”, “Security and systems are parallel”.
- Offered next steps: export options, Gantt versions, risk analysis.
This level of contextual understanding is powered by Visual Paradigm’s AI Chatbot, which functions as a collaborative modeling partner—not just a tool, but an expert in project lifecycle design.
More Than Just PERT: A Unified AI-Powered Modeling Platform
While this example focused on a PERT chart, the Visual Paradigm AI Chatbot is built to handle a full spectrum of modeling standards—making it a true AI-powered visual modeling platform.
- UML: For software system design and behavior modeling.
- ArchiMate: For enterprise architecture, mapping business, application, and technology layers.
- SysML: For complex system engineering, including requirements, behavior, and parametric modeling.
- C4 Model: For software architecture visualization—context, containers, components, and code.
- Mind Maps, Org Charts, SWOT, PEST: For strategic planning and stakeholder alignment.
Whether you’re modeling a digital transformation, designing a new system, or planning a large-scale infrastructure project, the AI Chatbot adapts to your language and delivers expert-level models—no technical expertise required.
Conclusion: The Future of Project Modeling is Conversational
Creating a PERT chart for an airport terminal isn’t just about drawing boxes and arrows. It’s about understanding dependencies, managing risk, and aligning teams across disciplines. With Visual Paradigm’s AI Chatbot, that process becomes a dialogue—not a chore.
From initial concept to detailed logic, the AI guides the user through every step, offering clarity, insight, and precision. And with the ability to generate, explain, refine, and export across multiple modeling standards, Visual Paradigm is the only platform that truly unifies project planning, architecture, and execution.
Ready to turn your next idea into a visual blueprint? Try it yourself with the shared session and experience the power of AI-driven modeling.