


Mapping the Cloud Transition: A Smart PERT Chart for Data Center Migration
Transitioning from an on-premises data center to the cloud is a complex, multi-phase endeavor that demands precise planning, clear dependencies, and real-time visibility. Without a structured approach, delays, cost overruns, and performance issues can derail the entire initiative. The challenge lies not just in executing tasks—but in understanding how each step interconnects, impacts timelines, and influences risk.
Enter the Visual Paradigm AI Chatbot—not just a diagram generator, but a collaborative modeling expert. By engaging in a natural conversation, users can transform high-level goals into detailed, executable PERT charts. This isn’t automation; it’s intelligent co-creation. The AI doesn’t just draw diagrams—it understands context, anticipates follow-ups, and refines logic based on real-world project constraints.
From Idea to Insight: The Interactive Journey of the PERT Chart
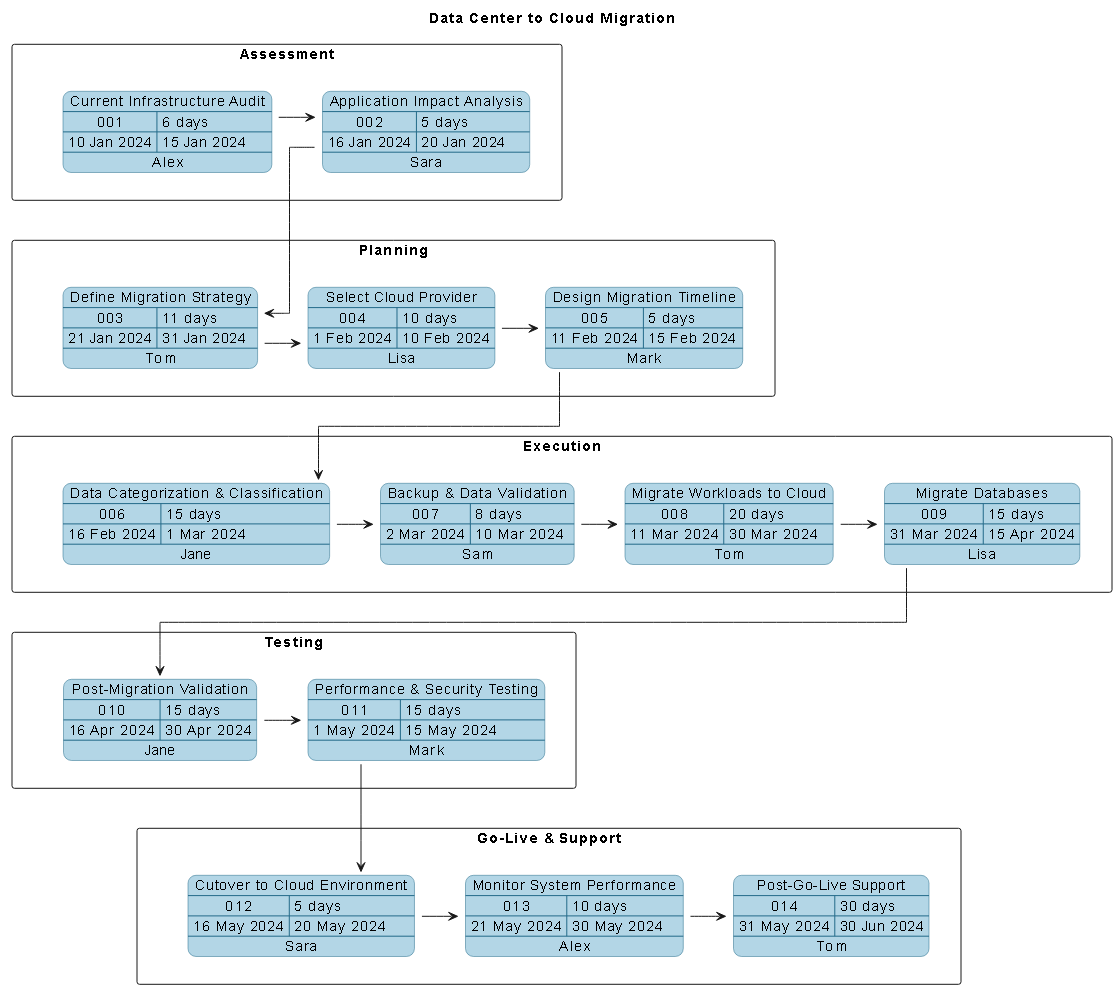
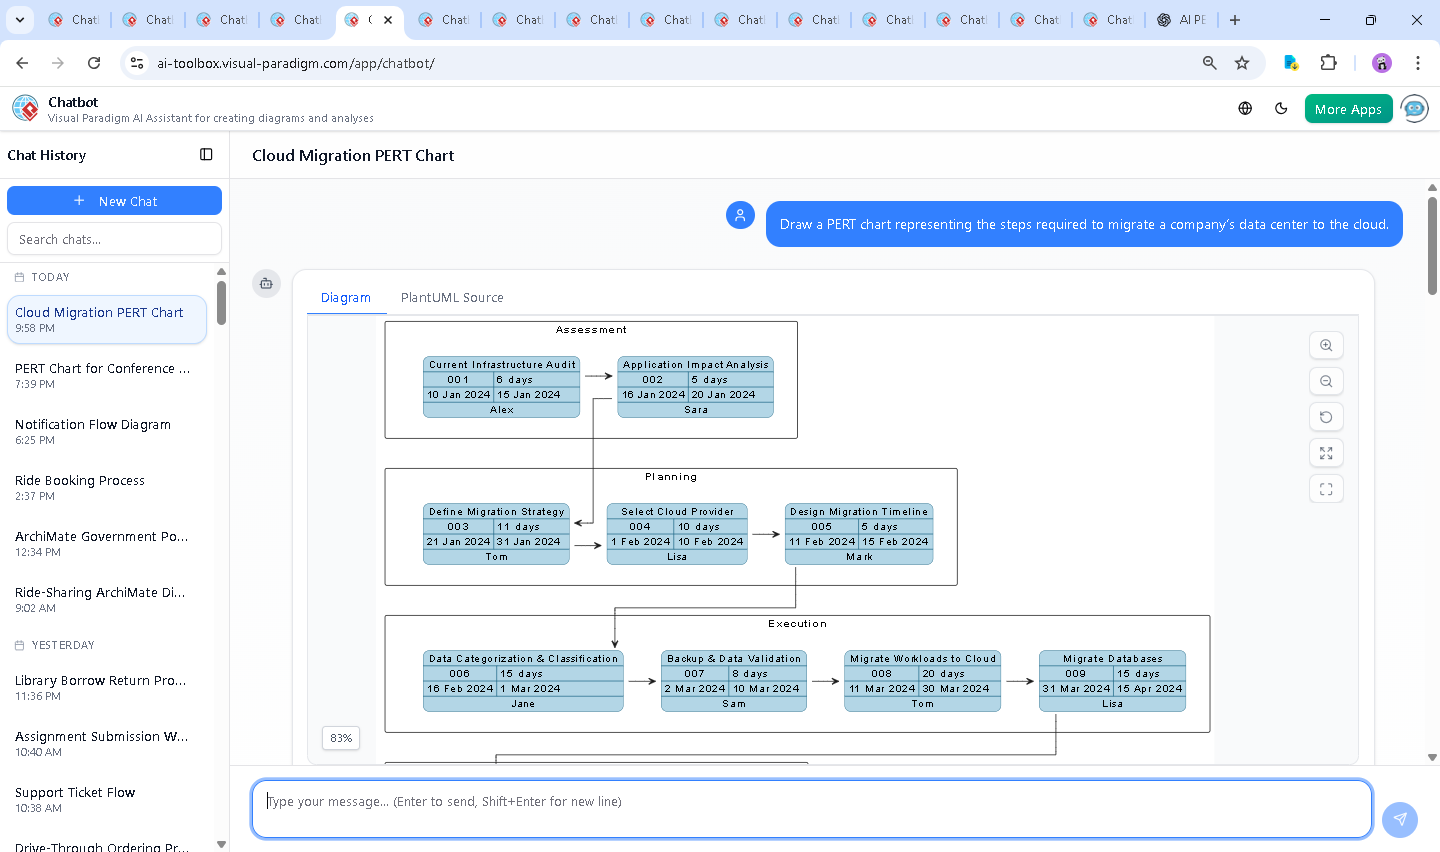
It began with a simple prompt: “Draw a PERT chart representing the steps required to migrate a company’s data center to the cloud.” The AI responded instantly, generating a structured PERT chart using PlantUML syntax, with tasks grouped by phase—Assessment, Planning, Execution, Testing, and Go-Live & Support. Each task included start and finish dates, duration, and responsible roles, ensuring accountability and clarity.
But the conversation didn’t stop there. The user asked: “What specific tools or technologies would you recommend for the performance testing phase (task11)?” This wasn’t a request for a list—it was a call for strategic guidance. The AI delivered a detailed, tiered recommendation:
- Load & Stress Testing: JMeter for legacy systems, K6 for cloud-native apps.
- Security Testing: OWASP ZAP for automation, Burp Suite for deep manual analysis.
- Monitoring: Prometheus + Grafana for real-time observability.
Each recommendation was grounded in industry practice and tailored to the migration context. The AI didn’t just answer—it enhanced the model with expert-level insight. When the user requested a diagram of the testing workflow, the AI was ready to deliver another visual, demonstrating its ability to pivot between modeling standards on the fly.
Decoding the PERT Chart Logic: Why This Structure Works
The generated PERT chart is not just a timeline—it’s a living blueprint of interdependencies. Here’s how the logic was built:
- Phased Task Grouping: Tasks are clustered by phase (e.g., Assessment, Planning), enabling teams to focus on one phase at a time while tracking cross-phase dependencies.
- Sequential Dependencies: Each task flows into the next via explicit
$dependency()calls (e.g.,task01 → task02), reflecting real-world workflow constraints. This ensures no task starts before its predecessor is complete. - Time-Based Planning: Start and finish dates are assigned with realistic durations (e.g., 6 days for audit, 20 days for workload migration), enabling accurate project forecasting.
- Responsibility Mapping: Each task assigns a responsible individual (e.g., Jane for data classification), promoting ownership and accountability.
The choice of PERT over Gantt is strategic: PERT emphasizes dependency clarity and critical path identification, which is crucial during migration when delays in one phase (e.g., data validation) can ripple through the entire timeline.
Conversational Intelligence: The AI as a Modeling Consultant
What sets Visual Paradigm apart is not just the diagram output—but the dialogue that shapes it. The AI doesn’t wait for perfect input. It listens, learns, and evolves. When the user asked for tool recommendations, the AI didn’t default to generic suggestions. Instead, it provided a structured, categorized comparison, aligning tools with specific testing needs and cloud environments.
Moreover, the AI offered actionable next steps: “Let me know if you’d like a diagram of this testing workflow or a sample test case script.” This level of responsiveness turns the chatbot into a true design partner—anticipating needs before they’re voiced.
Proof of this intelligence lies in the interface. The Visual Paradigm AI Chatbot maintains context across messages, remembers prior requests, and adapts its output accordingly. It’s not a one-shot generator—it’s a persistent, intelligent collaborator.
Beyond PERT: A Unified Platform for Enterprise Modeling
The Visual Paradigm AI Chatbot isn’t limited to PERT charts. It’s a full-spectrum visual modeling engine capable of generating diagrams across multiple standards:
- UML: Use cases, sequence diagrams, class models.
- ArchiMate: Enterprise architecture modeling with layers (business, application, technology).
- SysML: Requirements, block definition, activity, and parametric diagrams for complex systems.
- C4 Model: Context, containers, components, and code views for software architecture.
- Organizational Charts, Mind Maps, SWOT, PEST: Strategic planning and stakeholder alignment.
Whether you’re designing a cloud migration strategy, validating system behavior, or aligning stakeholders, the AI Chatbot adapts to your modeling language—making Visual Paradigm the only platform where you can switch between standards in a single conversation.
Conclusion: From Vision to Verified Execution
Migrating a data center to the cloud is no small feat. It requires precision, foresight, and collaboration. The Visual Paradigm AI Chatbot transforms this challenge into a conversational journey—where every question refines the model, every insight strengthens the plan.
With its ability to generate accurate PERT charts, provide expert recommendations, and support diverse modeling standards, Visual Paradigm is more than a tool. It’s an AI-powered visual modeling platform that evolves with your project—from idea to implementation.
Ready to build your next migration plan? Start your conversation with the AI Chatbot today and turn your vision into a validated, executable blueprint.