

Designing a Consumer Electronics Launch: How AI Transforms PERT Planning
Launching a new consumer electronics product is a complex, multi-phase journey — from vision to market. Traditional planning tools often fall short when it comes to capturing both the sequence of tasks and their dependencies with clarity. That’s where the Visual Paradigm AI Chatbot steps in: not just as a diagram generator, but as a collaborative modeling expert that turns high-level ideas into precise, actionable PERT charts.
When a product manager asked for a PERT chart outlining the design, testing, and release of a new device, the AI didn’t just draw a timeline — it engaged in a strategic conversation, refining logic, explaining dependencies, and adapting to follow-up questions with expert-level insight. This isn’t automation; it’s intelligent co-design.
From Concept to Clarity: The Interactive Journey
The process began with a simple prompt: “Draw a PERT chart for the steps involved in designing, testing, and releasing a new consumer electronics product.” The AI instantly responded with a fully structured PlantUML code for a PERT chart, organizing tasks into logical lanes: Product Requirements, Design, Development, Testing, and Release.
But the real value emerged after the initial output. The user asked: “Can you explain how the timeline for each task is determined in the PERT chart?” This wasn’t a request for a static diagram — it was a call for understanding.
Instead of a one-off answer, the AI delivered a layered explanation:
- It clarified that timelines are based on logical dependencies, not arbitrary dates.
- It broke down how each task’s duration reflects real-world benchmarks in electronics development — e.g., 15 days for software development, 10 days for safety compliance.
- It explained the critical path concept: the sequence of tasks that determines the project’s total timeline.
- It even introduced the PERT formula (optimistic, most likely, pessimistic estimates) and noted that this version used most likely durations for clarity.
This wasn’t a chatbot repeating a script — it was a modeling consultant guiding the user through the logic of project scheduling. The conversation didn’t end there. When the user asked for refinements, the AI offered to add risk buffers or probabilistic estimates, showing its ability to evolve the model based on depth of need.
Visualizing the Product Launch Journey
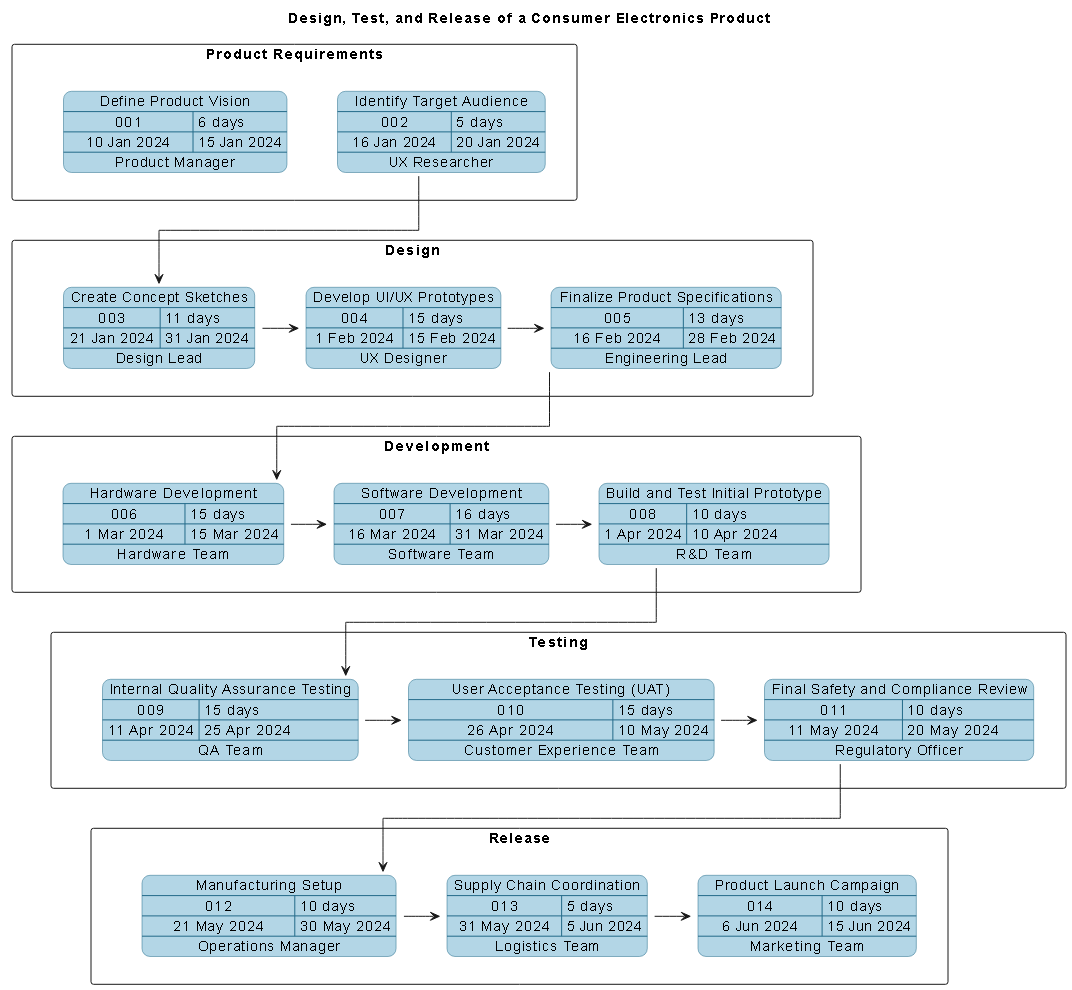
The final PERT chart maps a 16-week journey from product vision to market launch, with each task clearly labeled, dated, and connected by dependency lines. The critical path — the longest chain of tasks — runs from Define Product Vision to Product Launch Campaign, ensuring no delays can be ignored.
Decoding the Logic: Why This PERT Chart Works
The source logic behind the diagram is rooted in real-world product development:
- Phase-Based Grouping: Tasks are clustered into lanes (e.g., Design, Development, Testing) to reflect natural workflow stages.
- Sequential Dependencies: Each task only starts after its predecessor finishes. For example, Hardware Development (task06) can’t begin until Finalize Product Specifications (task05) is complete.
- Realistic Duration Assignment: The AI used industry-standard timelines based on electronics product cycles. Software development (16 days) takes longer than hardware (15 days) due to integration complexity.
- Responsible Roles: Each task includes a responsible owner (e.g., UX Designer, QA Team), enabling accountability and ownership.
- Start Date Alignment: Dates are calculated as finish date + 1 day to avoid overlap, ensuring smooth handoffs.
These choices reflect not just technical correctness, but strategic foresight — helping teams anticipate bottlenecks, allocate resources, and maintain momentum.
Conversational Intelligence: The AI as a Modeling Partner
What sets this experience apart is the depth of interaction. The AI didn’t just generate a diagram — it explained its reasoning, answered follow-ups with context**, and invited further refinement. This is the essence of the Visual Paradigm AI Chatbot: it functions as a real-time design partner.
For example, when asked to explain the timeline logic, the AI didn’t default to a generic definition. Instead, it:
- Provided a table of durations with justification.
- Introduced the PERT formula for probabilistic estimation.
- Highlighted that real-world PERT models include risk buffers — a nuance many tools ignore.
These insights aren’t just helpful — they’re foundational to effective project management.
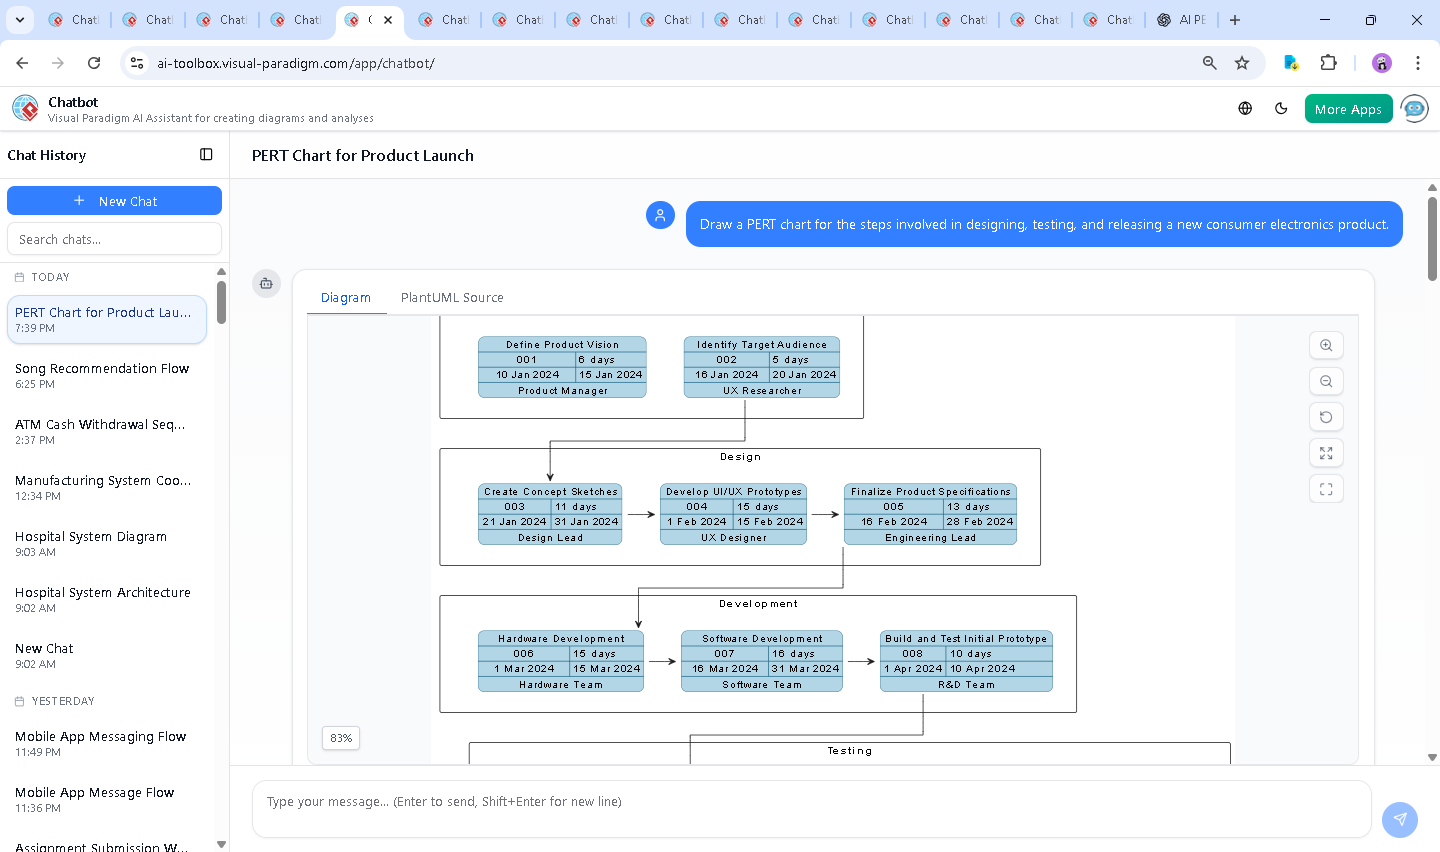
The screenshot of the chat interface shows the back-and-forth dialogue: from initial request to detailed explanation, demonstrating how the AI adapts to user needs — whether it’s a high-level overview or a deep dive into scheduling mechanics.
More Than PERT: A Full Modeling Suite
While this example focused on a PERT chart, the Visual Paradigm AI Chatbot is built to support a full spectrum of visual modeling standards. Whether you’re designing a system architecture with UML, mapping enterprise landscapes with ArchiMate, modeling complex systems with SysML, or visualizing software architecture with the C4 Model, the AI understands the semantics and syntax of each.
This versatility means you’re not switching tools — you’re using a single, intelligent platform that evolves with your project, from concept to deployment.
Conclusion: Launch with Confidence
Creating a PERT chart for a consumer electronics product launch isn’t just about drawing boxes and arrows. It’s about building a shared understanding of timelines, dependencies, and responsibilities. With the Visual Paradigm AI Chatbot, that process becomes collaborative, intelligent, and deeply insightful.
Whether you’re a product manager, systems engineer, or enterprise architect, the AI doesn’t just generate diagrams — it guides you through the thinking behind them. And with support for multiple modeling standards, it’s your all-in-one partner for visual design at scale.
Ready to build your next project’s roadmap? Explore the live PERT chart example and experience the power of AI-powered visual modeling.