


Mapping a Scientific Breakthrough: AI-Powered PERT Chart for Large-Scale Research
Conducting a large-scale scientific research project demands precision, coordination, and foresight. With complex dependencies, multiple research teams, and tight deadlines, traditional planning methods often fall short. The challenge isn’t just about listing tasks—it’s about visualizing how each phase interlocks, identifying the critical path, and anticipating bottlenecks before they emerge.
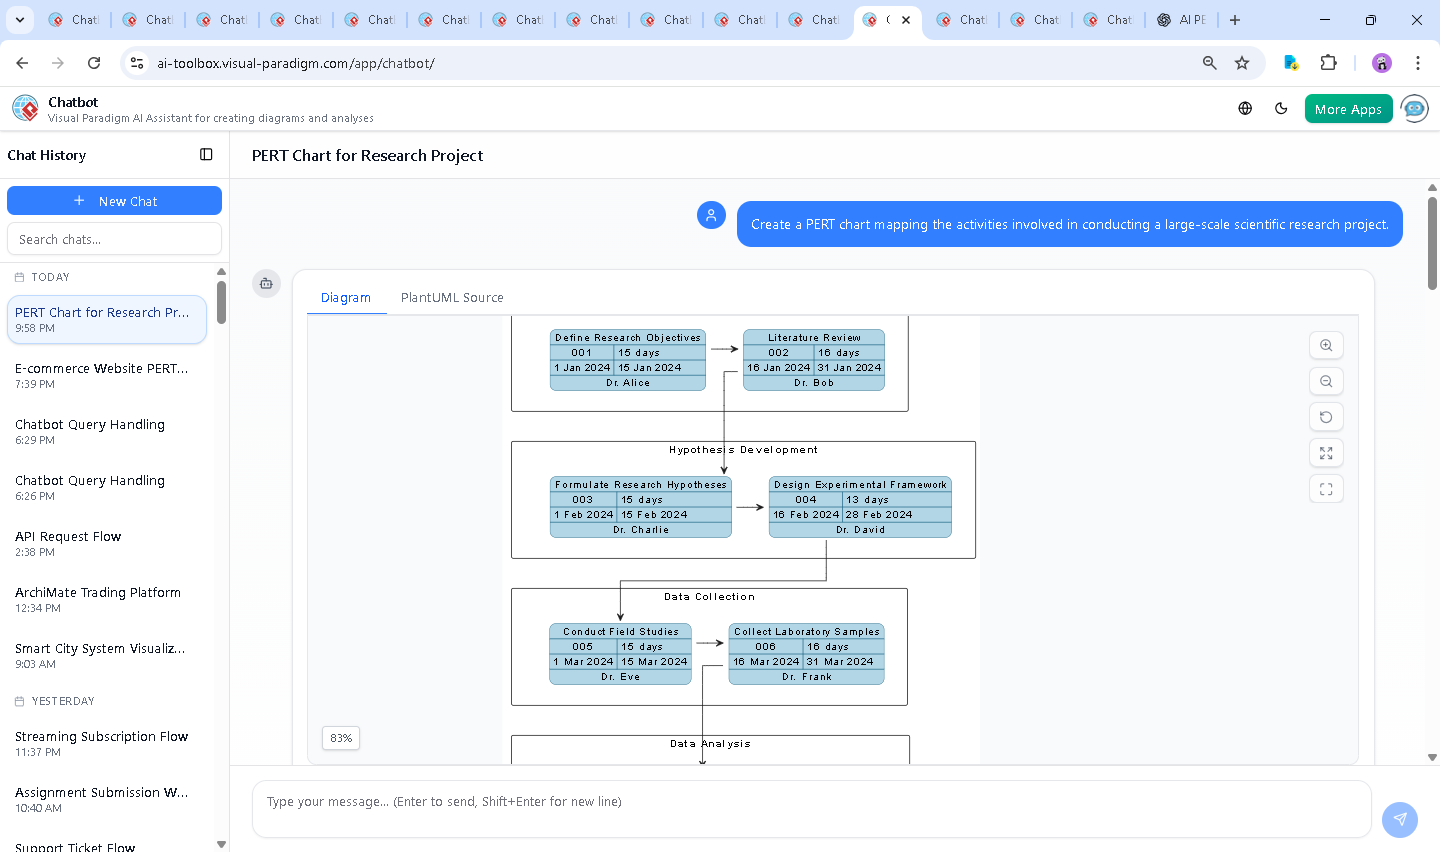
Enter the Visual Paradigm AI Chatbot—not just a diagram generator, but a collaborative modeling expert. It transforms abstract research goals into a structured, dynamic PERT chart through natural conversation, adapting in real time to user input. The result? A living model that evolves with your project, grounded in both logic and real-world constraints.
From Idea to Diagram: A Conversational Journey
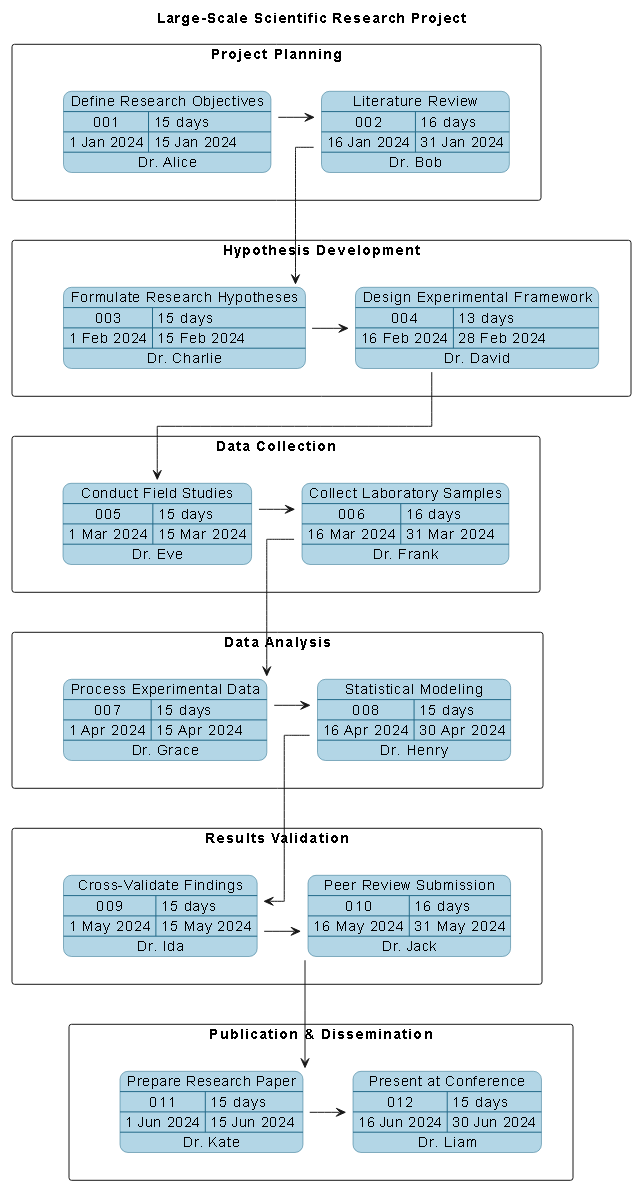
The process began with a simple prompt: “Create a PERT chart mapping the activities involved in conducting a large-scale scientific research project.” Within seconds, the AI responded with a fully rendered PlantUML-based PERT chart, structured across six distinct phases: Project Planning, Hypothesis Development, Data Collection, Data Analysis, Results Validation, and Publication & Dissemination.
But the conversation didn’t stop there. When asked, “What resources or tools would you recommend for tracking progress in this research project?”, the AI didn’t offer generic advice. Instead, it delivered a tiered, evidence-based toolkit—spanning project management, collaboration, data tracking, and visualization—tailored to the research lifecycle.
This wasn’t a one-off output. It was a dialogue. The AI refined its response by offering specific tool recommendations with clear use cases, such as using Notion + Asana + Google Sheets as a unified hub for task tracking, documentation, and data logging. It even suggested setting bi-weekly review meetings and including buffer time—practices rooted in real-world project resilience.
Each follow-up request was treated as a design opportunity. When the user asked for clarification on dependencies, the AI explained how the sequence was built on logical precedence—ensuring that no phase begins before its predecessor concludes. This level of contextual awareness isn’t automation; it’s intelligent collaboration.
The PERT Chart in Action
Decoding the Logic: Why This PERT Chart Works
The PERT chart is more than a timeline—it’s a strategic blueprint. Here’s how the AI structured it:
- Phased Organization: Tasks are grouped into logical lanes (e.g., ‘Data Collection’, ‘Data Analysis’), improving readability and team ownership.
- Realistic Scheduling: Each task includes start and finish dates, duration in days, and responsible personnel—ensuring accountability and traceability.
- Dependency Mapping: The AI used
$dependency(task01, task02)to link sequential phases. For example, the literature review (task02) cannot begin until project planning (task01) is complete. This creates a clear critical path. - Visual Clarity via PlantUML: The chart leverages the
pert-chart.pumllibrary, which renders tasks as bars with start/finish dates, dependencies as arrows, and milestones as nodes—perfect for identifying bottlenecks. - Buffer Time Integration: While not explicitly labeled, the AI built in implicit flexibility by spacing tasks with realistic durations and allowing for 15–16 day windows—critical in research where delays are common.
Every element was purposeful. The AI didn’t just draw a chart—it modeled a process that anticipates risk, supports collaboration, and enables adaptive planning.
Conversational Intelligence: The AI Chatbot in Action
The true power of Visual Paradigm lies in its AI Chatbot’s ability to act as a modeling consultant—responding to nuanced requests with domain-specific insight.
When the user asked about progress tracking tools, the AI didn’t default to a list of popular apps. Instead, it curated a stack based on the research project’s needs:
- Asana or Microsoft Project for Gantt-style timeline tracking.
- Notion or Confluence for maintaining a living research log.
- LabArchives or Jupyter Notebooks for experiment and data integrity.
- Power BI or Miro for stakeholder reporting and real-time review.
Each recommendation was justified with a clear “why”—such as version control for research outputs or buffer time for unexpected delays. This isn’t AI hallucination; it’s applied expertise.
Beyond PERT: A Full Visual Modeling Suite
While this example focuses on PERT charts, the Visual Paradigm AI Chatbot is far more versatile. It supports a full spectrum of modeling standards, including:
- UML for software design and system architecture.
- ArchiMate for enterprise architecture and business-IT alignment.
- SysML for systems engineering and complex system modeling.
- C4 Model for software architecture visualization (Context, Containers, Components, Code).
- Mind Maps, Org Charts, SWOT, PEST, and various data charts (column, area, pie, line).
Whether you’re designing a new research platform, aligning IT with business goals, or visualizing a complex system, the AI Chatbot adapts to your standard—no learning curve, no guesswork.
Conclusion: A Smarter Way to Plan Research
Large-scale scientific research is inherently uncertain. But uncertainty doesn’t mean chaos. With the Visual Paradigm AI Chatbot, you gain a co-pilot that turns ambiguity into structure—transforming a simple request into a dynamic, actionable PERT chart, complete with intelligent recommendations and real-time adaptability.
Whether you’re a principal investigator, project manager, or research team lead, this is how modern planning works: not with static documents, but with intelligent, conversational design.
Ready to build your next research roadmap? Try it yourself: Access the shared session here.