


Visualizing the Critical Path: How AI Transforms Infrastructure Project Planning
Planning a major infrastructure renovation is a complex endeavor—requiring precise coordination across planning, design, procurement, construction, and closure. Traditional methods often fall short in capturing dynamic dependencies and real-time progress. Enter the Visual Paradigm AI Chatbot: not just a diagram generator, but a collaborative modeling expert that transforms high-level project goals into structured, intelligent visual plans through natural conversation.
When prompted to create a PERT chart for a major infrastructure renovation, the AI didn’t just render a static diagram. It began by interpreting the task sequence, assigning realistic timelines, and defining dependencies—then invited further refinement. This wasn’t automation; it was intelligent co-design.
From Prompt to Precision: The Interactive Evolution of the PERT Chart
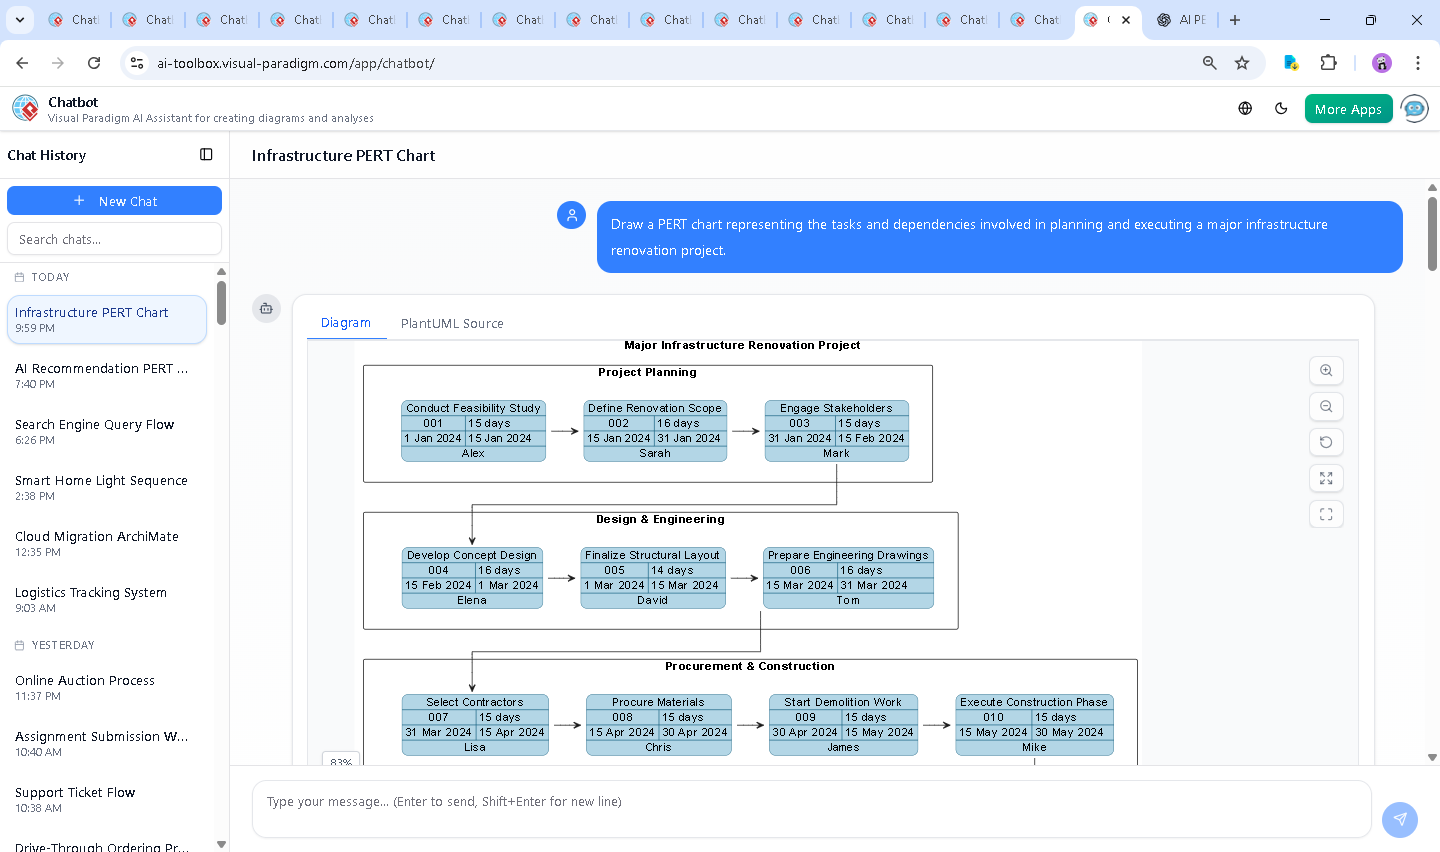
The journey began with a simple request: “Draw a PERT chart representing the tasks and dependencies involved in planning and executing a major infrastructure renovation project.” The AI responded with a fully structured PlantUML script, embedding actual dates, responsible roles, and logical task sequences—complete with lane-based categorization across key project phases.
But the conversation didn’t stop there. The user followed up: “What resources or tools would be needed to track progress across the different project phases?” This query triggered a deeper layer of insight. The AI didn’t just list tools—it mapped them to specific project functions: scheduling, risk tracking, documentation, and communication.
For example, the AI recommended Microsoft Project for its critical path analysis and Gantt integration, Power BI for real-time dashboarding, and Confluence for audit-ready documentation. It even suggested how the PERT chart could be imported into these platforms to maintain dynamic alignment with actual progress.
This back-and-forth—where the AI refined its output based on user intent—exemplifies its role as a modeling consultant, not just a tool. Each response built on the last, adapting to the user’s evolving needs with contextual awareness.
Decoding the PERT Chart Logic: Why This Structure Works
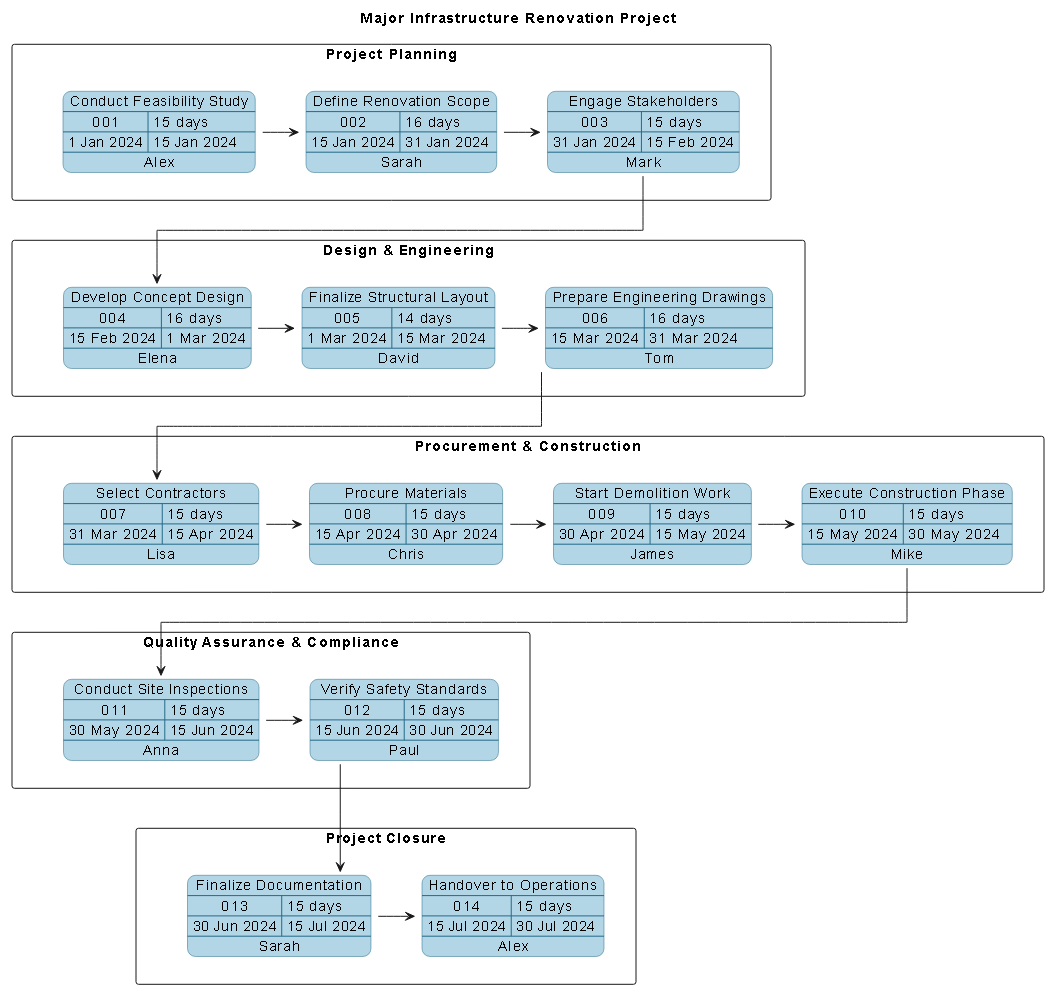
The generated PERT chart is more than a timeline—it’s a strategic blueprint. Let’s break down the source logic:
- Task Grouping by Phase: Tasks are organized into lanes: Project Planning, Design & Engineering, Procurement & Construction, Quality Assurance & Compliance, and Project Closure. This visual separation clarifies responsibility and phase transitions.
- Sequential Dependencies: Each task flows into the next in a logical chain:
Conduct Feasibility Study → Define Scope → Engage Stakeholders → Develop Concept Design → Finalize Layout → Prepare Drawings → Select Contractors → Procure Materials → Start Demolition → Execute Construction → Conduct Inspections → Verify Safety → Finalize Docs → Handover. This ensures no phase is skipped. - Realistic Timeframes: Each task is assigned a start and end date, with durations in days (e.g., 15 days for feasibility study). This enables accurate critical path identification.
- Resource Assignment: Each task includes a responsible owner (e.g., Alex, Sarah, David), ensuring accountability.
The use of $tasksInLane and $dependency directives in PlantUML ensures the PERT chart is both visually clean and technically accurate—ideal for stakeholder presentations and project audits.
Conversational Intelligence in Action
What sets Visual Paradigm apart is how the AI Chatbot evolves with the conversation. When the user asked about tracking tools, the AI didn’t default to generic suggestions. Instead, it:
- Identified functional needs (scheduling, documentation, risk tracking).
- Matched tools to those needs (e.g., Jira for dependency-heavy workflows).
- Provided integration guidance (e.g., importing the PERT chart into ClickUp or Monday.com).
- Offered a ready-made tool stack summary in table format for quick reference.
This level of contextual reasoning—where the AI acts as a strategic advisor—demonstrates its depth beyond basic diagram generation.
Beyond PERT: A Unified Modeling Platform
While this example focuses on PERT charts, the Visual Paradigm AI Chatbot is built to handle a full spectrum of modeling standards. Whether you’re designing enterprise systems with ArchiMate, modeling complex systems with SysML, visualizing software architecture with C4 Model, or brainstorming ideas with Mind Maps, the AI adapts seamlessly.
For instance, the same conversational interface can be used to:
- Generate a UML Use Case Diagram for system requirements.
- Model business processes using ArchiMate layers (business, application, technology).
- Design a C4 Model for software architecture (Context, Containers, Components, Code).
- Create SWOT or PEST analyses for strategic planning.
This versatility makes Visual Paradigm not just a diagramming tool—but an AI-powered visual modeling platform for IT, enterprise architecture, and project management professionals.
Final Thoughts: Build Smarter, Collaborate Faster
Traditional project planning tools often force users into rigid templates. Visual Paradigm’s AI Chatbot flips that model: it listens, learns, and evolves with your intent—turning ideas into actionable visual plans in real time.
Whether you’re managing a multi-phase infrastructure project or designing a new enterprise system, the AI doesn’t just draw diagrams—it guides the design process with expert insight.
Ready to experience the future of visual modeling? Explore the live session and see how the AI transforms your project planning—one conversation at a time.