
Visualizing the Mobile App Launch Journey: An AI-Driven PERT Chart for Precision and Risk Awareness
Launching a mobile application involves navigating a complex sequence of interdependent tasks—from concept to store release. Without a clear visual roadmap, teams risk delays, misaligned priorities, and overlooked risks. The Visual Paradigm AI Chatbot transforms this challenge into a collaborative design process, turning high-level goals into a precise, actionable PERT chart.
From Idea to Execution: A Collaborative Journey with the AI Chatbot
When the user initiated the request—”Generate a PERT chart to visualize the sequence and dependencies involved in developing and launching a new mobile application from concept to app store release”—the AI Chatbot didn’t just generate a diagram. It began by interpreting the intent, structuring the project into logical phases, and proposing a timeline grounded in realistic development cycles.
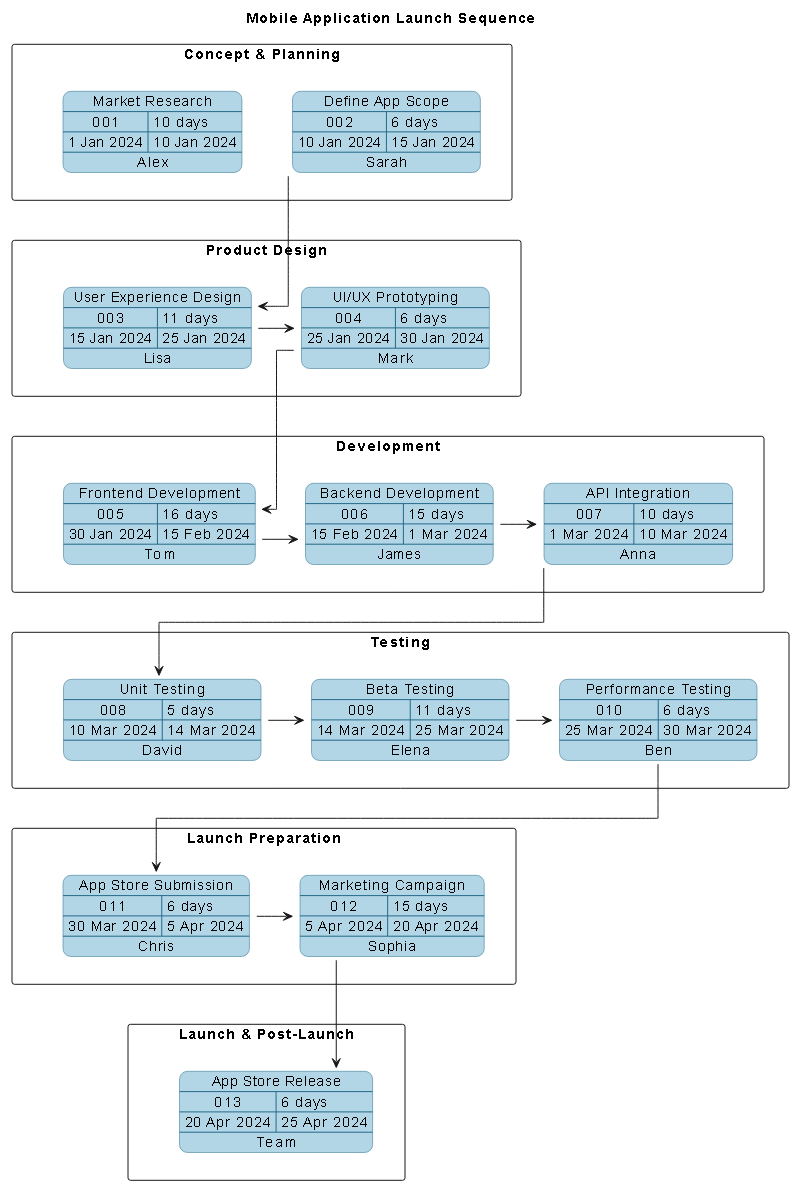
Within moments, the AI delivered a fully functional PlantUML-based PERT chart, segmented into lanes: Concept & Planning, Product Design, Development, Testing, Launch Preparation, and Launch & Post-Launch. Each task was assigned a start date, duration, and responsible owner—ensuring clarity and accountability.
But the real value emerged in the conversation. When the user asked, “How can we identify potential risks in the beta testing phase based on the current schedule?”, the AI didn’t just list risks—it contextualized them. It highlighted that the beta phase, starting 14 March and lasting 11 days, was vulnerable to late bug discovery, low user engagement, and platform-specific issues. The AI then offered mitigation strategies: structured feedback forms, cross-device testing, and a mid-phase review meeting.
This wasn’t a static output. It was a dynamic dialogue—proof that the Visual Paradigm AI Chatbot functions as a modeling consultant, not just a diagram generator. The user could refine the logic with follow-ups like “Explain this branch” or “AI, refine the logic”, and the AI responded with deeper insights and actionable adjustments.
Decoding the PERT Chart Logic: Why This Structure Works
The PERT chart was built using PlantUML’s $tasksInLane and $dependency syntax, ensuring precision and scalability. Here’s how each component contributes:
- Phased Lanes: Tasks are grouped by workflow stage (e.g., Development, Testing), enabling teams to track progress across domains.
- Time-Based Scheduling: Each task has a defined start date, finish date, and duration (in days), allowing for timeline forecasting and critical path identification.
- Dependency Mapping: The
$dependency(task02, task03)notation ensures that tasks are linked in sequence—e.g., User Experience Design must finish before UI/UX Prototyping begins. This enforces logical flow and prevents parallel execution of dependent work. - Ownership Assignment: Each task includes a responsible individual, supporting accountability and reducing handoff delays.
By choosing PERT over Gantt, the chart emphasizes task interdependencies and time uncertainty—ideal for agile environments where timelines are fluid and risk exposure must be continuously assessed.
Conversational Intelligence: The AI as a Modeling Partner
What sets Visual Paradigm apart is how the AI Chatbot evolves with the user’s intent. The conversation wasn’t one-way; it was iterative. After the initial PERT chart was generated, the user probed for risk insights—prompting the AI to analyze the timeline’s vulnerabilities and suggest proactive measures.
The AI didn’t stop at risk identification. It proposed actionable steps: setting a review meeting on Day 7 of beta testing, defining KPIs like crash rate, and recommending a follow-up test round. This level of contextual intelligence transforms the tool from a visualization aid into a strategic partner.
These interactions are captured in the chat interface, where every request and response is logged. The
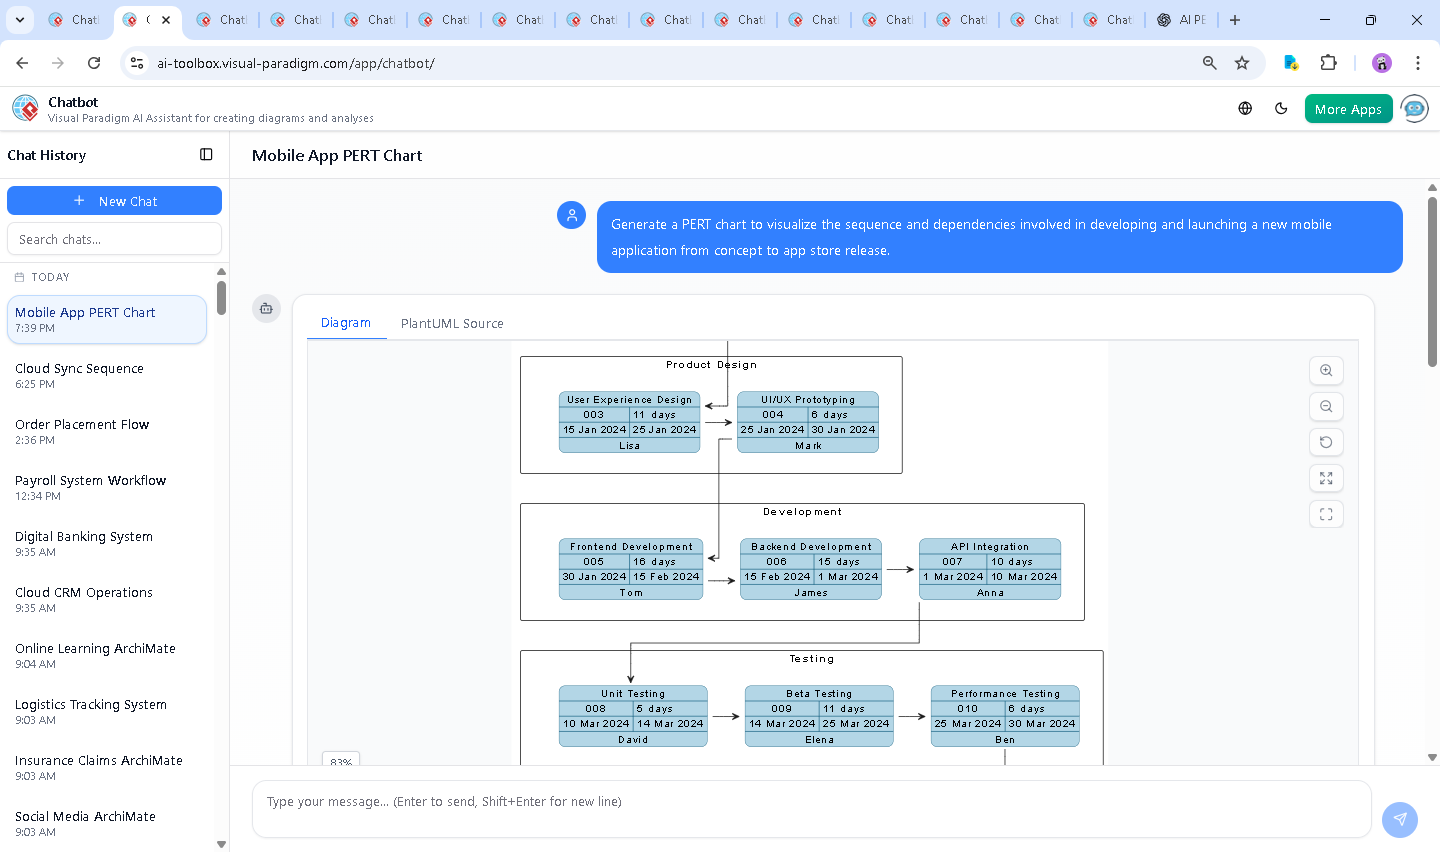
showcases the real-time collaboration—proof that the AI understands not just syntax, but business logic, project constraints, and team dynamics.
Beyond PERT: A Full Suite of Modeling Standards
The Visual Paradigm AI Chatbot isn’t limited to PERT charts. It seamlessly supports a wide range of modeling standards, making it a unified platform for enterprise architects, software engineers, and product teams:
- UML: For system design, class diagrams, sequence diagrams, and use case modeling.
- ArchiMate: To model enterprise architecture, business processes, and IT systems.
- SysML: For systems engineering, requirements modeling, and behavior diagrams.
- C4 Model: To visualize software architecture at multiple abstraction levels (Context, Containers, Components, Code).
- Additional Diagrams: Mind Maps, Org Charts, SWOT, PEST, and various data visualization types (column, area, pie, line charts).
This versatility means teams can switch between modeling languages within the same session—no context switching, no learning curves. Whether designing a new app, aligning business goals with IT, or mapping system behavior, the AI Chatbot adapts to the standard and the user’s intent.
Conclusion: A Smarter Way to Model, Launch, and Adapt
The mobile app launch sequence PERT chart is more than a timeline—it’s a living blueprint shaped by intelligent conversation. With Visual Paradigm’s AI Chatbot, teams gain not just a diagram, but a collaborative design environment that anticipates risks, supports decision-making, and evolves with the project.
Whether you’re planning a product launch, designing a system, or aligning stakeholders, the AI-powered visual modeling platform ensures clarity, precision, and agility.
Ready to transform your project planning? Try the Visual Paradigm AI Chatbot today and experience the future of visual modeling.