

From Concept to Grand Opening: An AI-Powered PERT Chart for Launching a New Restaurant
Opening a restaurant is more than just serving food—it’s a complex project involving planning, design, legal compliance, staffing, and marketing. Without a clear roadmap, timelines can slip, dependencies go unnoticed, and projects stall. That’s where a well-structured PERT chart becomes essential: it maps out tasks, timelines, and dependencies to keep the project on track.
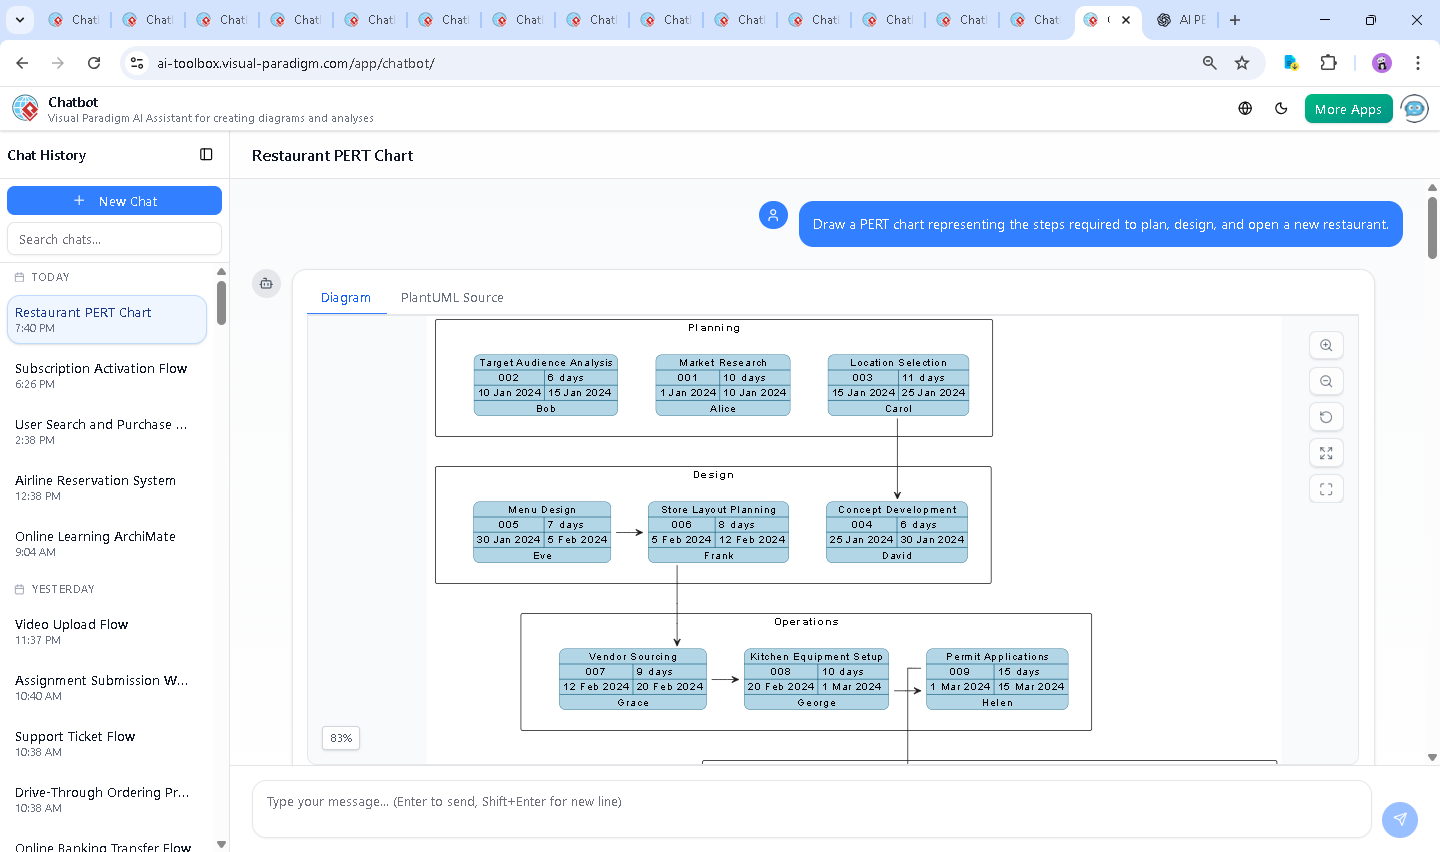
But creating a precise PERT chart from scratch requires deep project management knowledge—and time. That’s where the Visual Paradigm AI Chatbot steps in. Instead of wrestling with diagramming tools or templates, you simply describe your goal in plain language, and the AI transforms your vision into a professional, interactive PERT chart—complete with dates, responsibilities, and logical dependencies.
Interactive Journey: How the PERT Chart Evolved Through Conversation
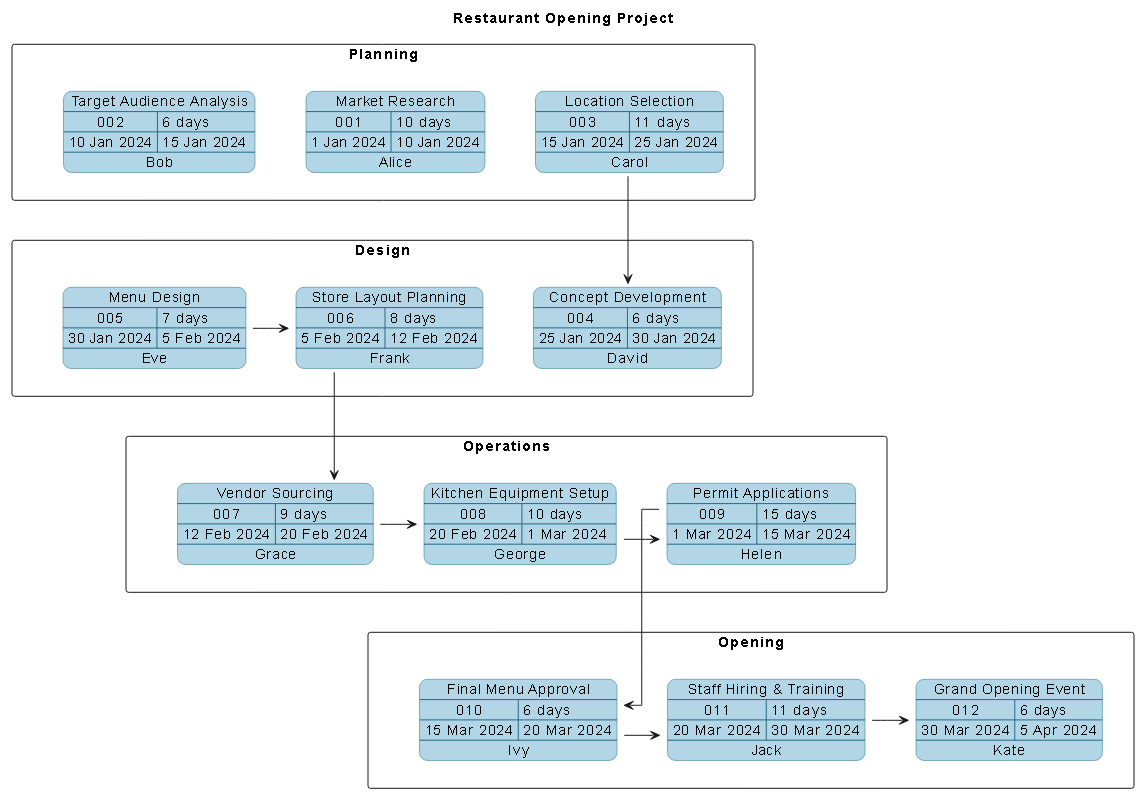
The journey began with a simple prompt: “Draw a PERT chart representing the steps required to plan, design, and open a new restaurant.” Within seconds, the Visual Paradigm AI Chatbot generated a fully formatted PERT chart using PlantUML syntax, structured across four key phases: Planning, Design, Operations, and Opening.
But the conversation didn’t stop there. When the user asked, “Explain this diagram,” the AI didn’t just repeat the data—it provided a deep, structured breakdown of each phase, highlighting critical dependencies, timelines, and responsibilities. It didn’t just show the chart; it explained the logic behind it, identifying the critical path and calling out potential bottlenecks—such as the 15-day permit application phase.
Follow-up requests like “Refine the logic” or “Explain this branch” were handled seamlessly. The AI adjusted task sequences, clarified responsibilities, and even suggested adding buffer time to mitigate delays—proving it’s not just a diagram generator, but a collaborative modeling expert.
Logic Breakdown: Why This PERT Chart Works
The PERT chart is built on a foundation of clear task sequencing and dependency mapping. Here’s how the logic was implemented:
- Phase-based Structure: Tasks are grouped into lanes—Planning, Design, Operations, and Opening—making it easy to visualize the lifecycle of the project.
- Temporal Precision: Each task has a defined start and finish date, with durations in days. For example, Market Research runs from January 1 to January 10, setting the timeline baseline.
- Dependency Mapping: The AI used
$dependency()to link tasks in sequence. For instance,$dependency(task03, task04)ensures that Location Selection must finish before Concept Development can begin. - Responsible Assignments: Each task includes a responsible individual (e.g., Alice, Bob, Carol), enabling accountability and resource planning.
- Critical Path Identification: The AI highlighted the longest chain of dependent tasks—running from Market Research to Grand Opening Event—which totals approximately 60 days. This path determines the project’s minimum duration.
The choice of PERT over other diagram types was deliberate. Unlike Gantt charts, which focus on duration and milestones, PERT emphasizes task interdependencies and uncertainty. This makes it ideal for complex projects like restaurant launches, where delays in one area (e.g., permit approvals) can cascade across multiple phases.
Conversational Value: The AI as Your Modeling Partner
What sets Visual Paradigm apart is not just the diagram output—but the conversational intelligence behind it. The chat history shows how the AI evolved from a basic diagram generator to a consultative design partner.
When asked to explain the diagram, the AI didn’t just list tasks. It:
- Clarified the purpose of each phase.
- Highlighted the critical path and its implications.
- Offered pro tips: monitoring permit timelines, adding buffer time, and parallelizing tasks.
- Invited further refinement: “Would you like to add risk factors or buffer times?”
This level of interaction turns the tool into a collaborative workspace—where you’re not just creating a diagram, but co-designing a project strategy.
Platform Versatility: Beyond PERT Charts
The Visual Paradigm AI Chatbot isn’t limited to PERT charts. It’s a full-spectrum AI-powered visual modeling platform that supports multiple standards and use cases:
- UML – For software design, system behavior, and class modeling.
- ArchiMate – For enterprise architecture, defining business, application, and technology layers.
- SysML – For systems engineering, including requirements, block definition, and parametric modeling.
- C4 Model – For software architecture visualization, from context to containers, components, and code.
- Mind Maps, Org Charts, SWOT, PEST, and Charts (column, pie, line, area) – For strategic planning, stakeholder analysis, and data visualization.
Whether you’re a project manager, enterprise architect, or startup founder, the AI Chatbot adapts to your needs—transforming natural language into accurate, standardized diagrams across domains.
Conclusion & CTA
Launching a restaurant is a high-stakes, multi-phase endeavor. With the Visual Paradigm AI Chatbot, you no longer need to rely on guesswork or manual diagramming. The platform delivers a precise, intelligent, and interactive PERT chart—crafted using the Visual Paradigm AI Chatbot—and backed by real-time collaboration, expert-level insights, and support across multiple modeling standards.
Ready to bring your next project to life? Explore the full restaurant PERT chart example and experience how AI is redefining visual modeling.