


Designing a Smart City’s Future: A Collaborative PERT Chart Journey
Building a smart city infrastructure is more than deploying technology—it’s about orchestrating complex systems, timelines, and dependencies across urban planning, engineering, and public services. The challenge lies in visualizing this intricate web of activities in a way that’s both precise and actionable. That’s where the Visual Paradigm AI Chatbot steps in—not as a passive tool, but as a strategic modeling partner.
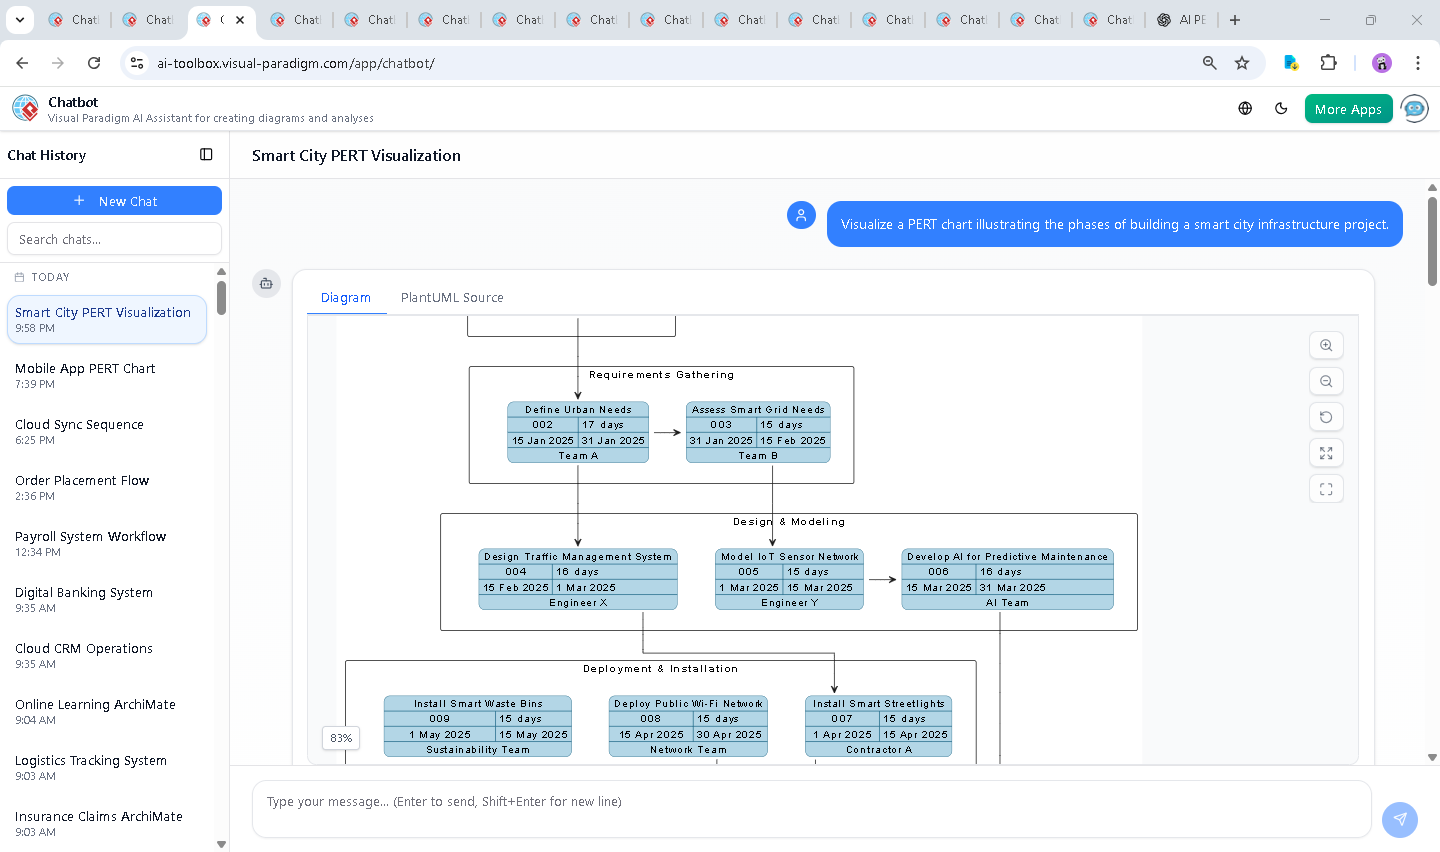
When the user prompted, “Visualize a PERT chart illustrating the phases of building a smart city infrastructure project,” the AI didn’t just generate a diagram. It interpreted the intent, structured the project lifecycle into logical phases, and mapped dependencies with technical accuracy—proving that modern visual modeling is no longer about drawing shapes, but about co-creating intelligent workflows.
From Concept to Precision: A Conversational Design Process
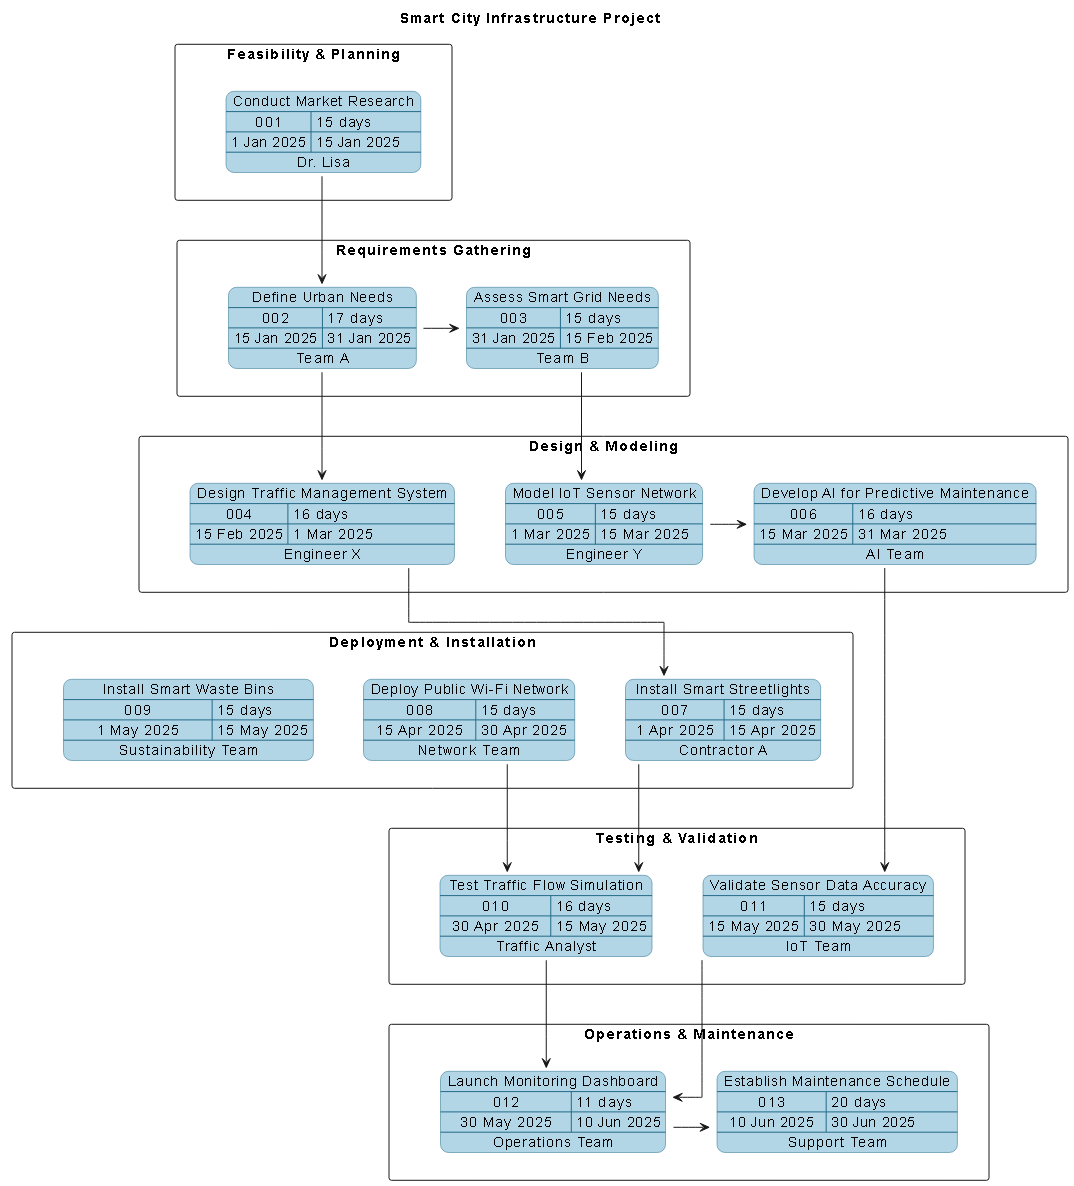
The journey began with a simple request. The AI responded with a fully rendered PERT chart using PlantUML syntax, structured into six key phases: Feasibility & Planning, Requirements Gathering, Design & Modeling, Deployment & Installation, Testing & Validation, and Operations & Maintenance. Each task was assigned a clear start date, duration, responsible team, and logical dependency.
But the conversation didn’t stop there. The user asked, “What challenges might arise during the testing phase of the smart traffic management system?” This wasn’t a request for a diagram—it was a call for insight. The AI delivered a detailed breakdown of eight critical challenges, complete with real-world impacts and mitigation strategies, all formatted for clarity and decision-making.
This exchange revealed the AI Chatbot’s true intelligence: it doesn’t just respond—it anticipates. When asked to refine the logic or explain a branch, the chatbot didn’t default to generic answers. Instead, it offered context-specific analysis, such as how legacy system integration affects data flow, or how edge-case simulations can prevent real-world failures.
Decoding the PERT Chart Logic: Why This Structure Works
The PERT chart was not built arbitrarily. Each phase and dependency was crafted to reflect real-world project constraints and interdependencies:
- Feasibility & Planning (Jan 1–15, 2025): Sets the foundation. Market research must precede any requirement definition.
- Requirements Gathering (Jan 15–Feb 15, 2025): Two parallel tracks—urban needs and smart grid—both critical to inform later design decisions.
- Design & Modeling (Feb 15–Mar 31, 2025): Tasks like traffic system design and IoT network modeling depend on completed requirements.
- Deployment & Installation (Apr 1–May 15, 2025): Physical rollout begins only after design approval.
- Testing & Validation (Apr 30–May 30, 2025): Testing begins before full deployment, with tasks like traffic simulation and sensor validation running in parallel.
- Operations & Maintenance (May 30–Jun 30, 2025): Final phase, but only after successful validation and monitoring dashboard launch.
The dependency logic is especially robust. For example:
$dependency(task02, task04)ensures that traffic system design can’t start until urban needs are defined.$dependency(task06, task11)links AI-driven predictive maintenance to sensor data validation—critical for system reliability.$dependency(task10, task12)confirms that the monitoring dashboard can’t launch until traffic tests pass.
This structure reflects the critical path method—a cornerstone of project management. The AI didn’t just apply it; it embedded it into the narrative, ensuring the chart isn’t just visual but functionally intelligent.
Conversational Intelligence in Action
What sets this process apart is the depth of the dialogue. The user didn’t just ask for a chart—they asked for a strategic review. The AI responded with a structured analysis of testing phase risks, including:
-
- Data accuracy and real-time feedback issues
- Challenges in handling rare or extreme events
- Cybersecurity and privacy concerns
Each challenge was paired with a concrete mitigation strategy, demonstrating the AI’s ability to think beyond diagramming and into operational risk management. This level of insight is what transforms a diagram from a static image into a living decision-making asset.
Beyond PERT: A Full-Spectrum Modeling Platform
The Visual Paradigm AI Chatbot isn’t limited to PERT charts. It’s a full-spectrum modeling engine capable of handling:
- UML: For software design and system architecture.
- ArchiMate: To model enterprise architecture and business-IT alignment.
- SysML: For systems engineering and complex system modeling.
- C4 Model: To visualize software architecture at different abstraction levels.
- Mind Maps, Org Charts, SWOT, PEST: For strategic planning and stakeholder alignment.
This versatility means teams can use the same conversational interface to switch between standards—whether designing a smart grid (SysML), mapping business capabilities (ArchiMate), or visualizing team structures (Org Chart)—all within one AI-powered environment.
Conclusion: Where Vision Meets Execution
Visualizing a smart city project isn’t just about timelines—it’s about foresight, risk management, and collaboration. The PERT chart generated here isn’t a static artifact; it’s the product of a dynamic conversation between human intent and AI intelligence.
By leveraging the Visual Paradigm AI Chatbot, teams can move from abstract ideas to precise, validated models in minutes—complete with dependency logic, risk insights, and real-world feasibility. Whether you’re a city planner, systems engineer, or enterprise architect, the platform turns complex projects into clear, actionable blueprints.