


From Idea to Bestseller: How AI Maps the Book Publishing Journey
Launching a bestselling book is more than just writing—it’s a complex orchestration of planning, creation, refinement, and outreach. The challenge lies in aligning timelines, responsibilities, and dependencies across multiple phases: writing, editing, publishing, and distribution. Without a clear visual roadmap, teams risk delays, miscommunication, and missed opportunities.
Enter the Visual Paradigm AI Chatbot—not just a diagram generator, but a conversational modeling expert that transforms vague ideas into structured, actionable project plans. By leveraging natural language, users can define goals, and the AI delivers not just a PERT chart, but a strategic blueprint for success.
From Prompt to Precision: The Evolution of a Publishing Plan
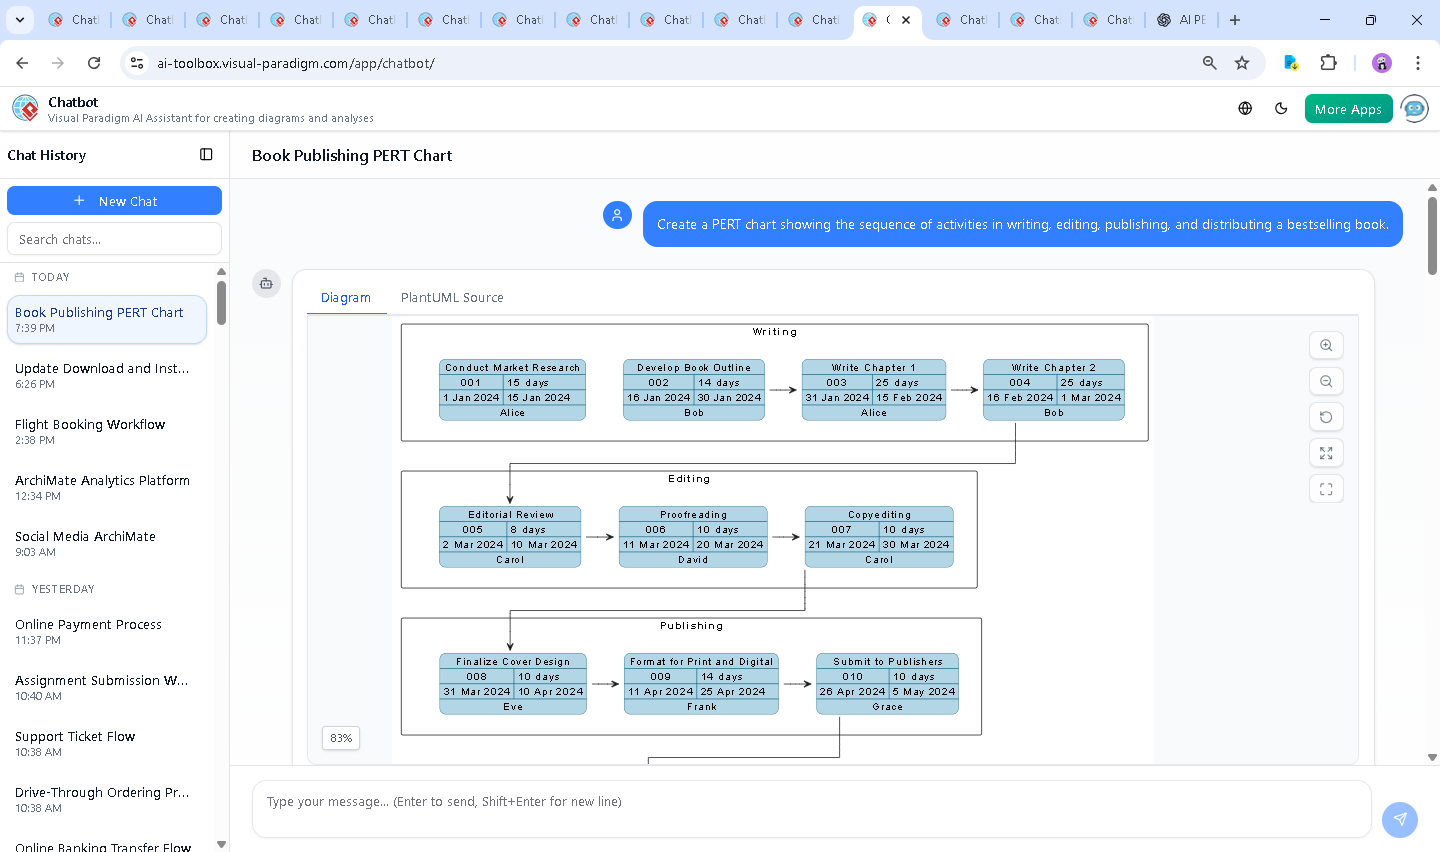
It began with a simple request: “Create a PERT chart showing the sequence of activities in writing, editing, publishing, and distributing a bestselling book.”
Within seconds, the Visual Paradigm AI Chatbot responded with a fully structured PERT chart in PlantUML syntax, complete with:
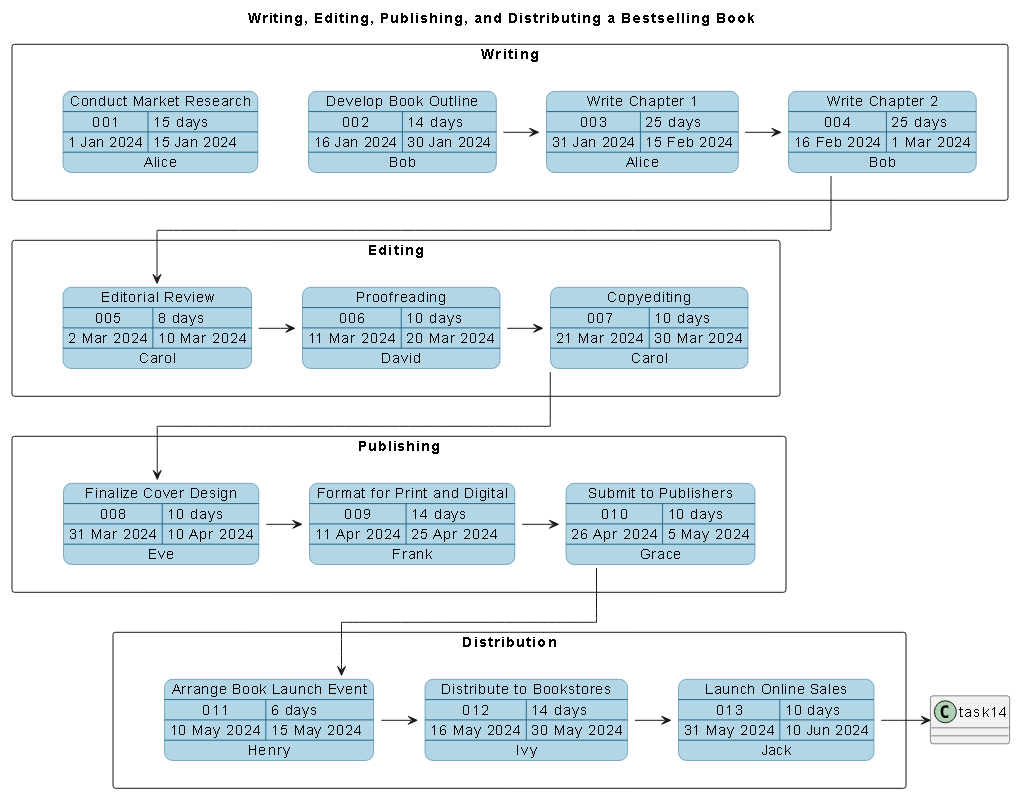
- Four clearly defined lanes: Writing, Editing, Publishing, and Distribution
- Realistic start and finish dates
- Assigned team roles (Alice, Bob, Carol, etc.)
- Explicit task dependencies
But the real value emerged in the conversation that followed. When the user asked, “Explain this diagram,” the AI didn’t just restate the data—it offered a deep, contextual breakdown of the project’s flow, timeline, and risk points.
For example, the AI highlighted the critical path—the sequence of tasks that determines the total project duration. It pointed out that delays in editing or formatting could ripple through to publishing and distribution. It also suggested that adding parallel activities (like designing the cover while writing) could shorten the timeline—a refinement the user hadn’t considered.
This isn’t automation. It’s collaborative intelligence. The AI didn’t just output a diagram—it acted as a project consultant, anticipating questions and offering strategic insights.
Decoding the Logic: Why This PERT Chart Works
The PERT chart is built on a foundation of project management best practices. Here’s how each element contributes to a realistic and actionable plan:
1. Phased Structure
The four lanes—Writing, Editing, Publishing, and Distribution—reflect the natural progression of book development. Each phase builds on the last, ensuring no step is skipped.
2. Task Dependencies
Every task is connected via $dependency() calls, creating a linear flow:
- Writing must finish before editing begins
- Editing must conclude before publishing activities can start
- Final submission to publishers must happen before launch events or distribution
This ensures no task starts prematurely, preventing bottlenecks and rework.
3. Realistic Scheduling
Each task includes:
- Start and finish dates (e.g., Chapter 1: 31 Jan – 15 Feb 2024)
- Duration in days (e.g., 25 days for Chapter 1)
- Responsible person (e.g., Alice for writing, Carol for editorial review)
This enables precise resource allocation and accountability.
4. Critical Path Identification
The AI highlighted the critical path: from market research to online sales. This sequence determines the project’s total duration—approximately 65 days. Any delay here directly impacts the launch date.
5. Scalability & Flexibility
While this version is sequential, the AI can easily adapt it. For instance, the user could later request: “Add parallel tasks—like cover design while writing.” The AI would then modify the diagram to show overlapping activities, reducing the overall timeline.
Conversational Intelligence in Action
What sets Visual Paradigm apart is how the AI evolves with the user. After the initial chart was generated, the follow-up request—“Explain this diagram”—triggered a deeper analysis. The AI didn’t just list tasks. It:
- Explained the purpose of PERT charts
- Identified risk points (e.g., editing and formatting as bottlenecks)
- Offered strategic suggestions (e.g., parallel workflows)
- Provided a summary table for quick reference
This isn’t a static diagram. It’s a living document shaped by dialogue.
Beyond PERT: A Full Modeling Suite
The Visual Paradigm AI Chatbot isn’t limited to PERT charts. It’s a multi-standard modeling assistant capable of generating:
- UML diagrams (use case, class, sequence)
- ArchiMate models for enterprise architecture
- SysML for systems engineering
- C4 Model for software architecture
- Mind Maps for brainstorming
- SWOT, PEST, Org Charts, and more
Whether you’re managing a book launch, designing a software system, or mapping organizational strategy, the AI adapts to your domain. It understands context, maintains consistency, and ensures models align with industry standards.
Turn Vision into Reality—With AI Guidance
From concept to launch, publishing a bestselling book demands precision, coordination, and foresight. The Visual Paradigm AI Chatbot turns this challenge into a collaborative journey—where every question leads to a clearer plan.
Whether you’re an author, publisher, or project lead, this AI-powered visual modeling platform empowers you to:
- Define project scope with clarity
- Visualize timelines and dependencies
- Assign responsibilities with confidence
- Anticipate risks and optimize workflows
Start your next project with confidence. Craft your next PERT chart, or explore other models—all powered by the Visual Paradigm AI Chatbot.