

Designing a Healthcare Wearable Ecosystem with AI-Powered Precision
Creating a structured, scalable model of a healthcare wearable ecosystem is no small task. With multiple layers—physical devices, mobile interfaces, cloud analytics, clinical workflows, and human users—the complexity demands more than static diagrams. That’s where the Visual Paradigm AI Chatbot steps in, transforming abstract ideas into intelligent, interactive system models through natural conversation.
From Concept to Structure: An Interactive Modeling Journey
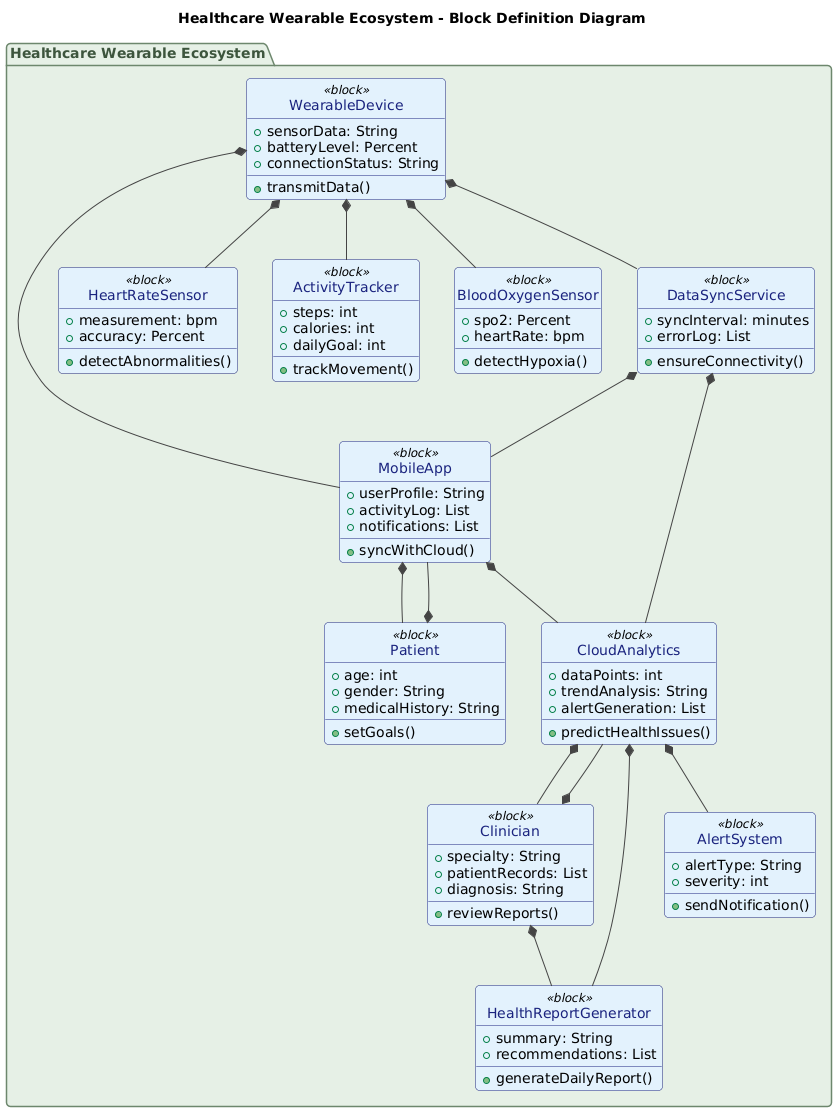
The journey began with a simple prompt: “Visualize a Block Definition Diagram that represents the structure of a healthcare wearable ecosystem linking devices, mobile apps, cloud analytics, and clinicians.” Within seconds, the AI Chatbot delivered a fully rendered PlantUML-based Block Definition Diagram (BDD)—not just a visual, but a living model of system architecture.
But the real power emerged in the follow-up. When the user asked, “Explain this diagram,” the AI didn’t just summarize—it contextualized. It broke down each block, clarified relationships, and even anticipated future needs by suggesting extensions like use case diagrams, sequence diagrams, and compliance modeling.
For instance, when the user requested clarification on a specific branch—”Explain this branch”—the AI responded with a detailed breakdown of data flow from wearable sensors to cloud analytics, highlighting how the DataSyncService ensures reliability and how the AlertSystem triggers interventions based on thresholds.
Each exchange reinforced the Chatbot’s role as a collaborative modeling expert—offering not just visuals, but strategic insight, architectural logic, and future-proofing suggestions.
Decoding the Logic: Why Block Definition Diagrams Work Here
Block Definition Diagrams (BDDs) in SysML are ideal for defining the structural components of complex systems—exactly what the healthcare wearable ecosystem demands. Unlike traditional UML class diagrams, BDDs emphasize the system-level composition, making them perfect for modeling:
- Physical and logical components: WearableDevice, HeartRateSensor, BloodOxygenSensor
- Software services: DataSyncService, AlertSystem, HealthReportGenerator
- Human roles: Patient, Clinician
- Interdependencies: Data flow, control flow, ownership
Each block is a <<block>> in SysML, representing a reusable, modular unit of system structure. The diagram uses composition relationships (e.g., WearableDevice *-- HeartRateSensor) to show that sensors are internal parts of the device. Other relationships, like MobileApp *-- CloudAnalytics, depict data transmission and service dependencies.
Notably, the diagram includes a central DataSyncService block—a critical design choice. It’s not just a connector; it’s a dedicated component ensuring data integrity, handling retries, and logging errors. This reflects real-world engineering concerns that many diagram tools overlook.
The HealthReportGenerator and AlertSystem are also key: they turn raw data into actionable insights, directly supporting clinical decision-making.
Conversational Intelligence in Action
What sets Visual Paradigm apart isn’t just the diagram output—it’s the depth of the conversation. The AI didn’t just generate a diagram; it acted as a modeling consultant, responding to nuanced requests with precision.
When the user asked for a breakdown, the AI didn’t just list blocks. It mapped the data journey: from sensor → wearable → mobile → cloud → alert/report → clinician. It highlighted how the Clinician receives aggregated insights, not raw data—ensuring privacy and relevance.
Even after the initial model was complete, the AI offered next steps: “Would you like a sequence diagram of the data flow? A C4 diagram? A PESTEL analysis of the market?” This level of contextual awareness turns the Chatbot into a full-stack systems architect.
Beyond BDD: A Unified Platform for Enterprise Modeling
The Visual Paradigm AI Chatbot isn’t limited to SysML. It seamlessly supports a full suite of modeling standards, including:
- UML: For software design, component, and activity modeling
- ArchiMate: For enterprise architecture, aligning business, application, and technology layers
- C4 Model: For system context, container, component, and code-level diagrams
- Mind Maps, Org Charts, SWOT, PEST: For strategic planning and stakeholder alignment
- Charts (column, area, pie, line): For data visualization and KPI tracking
This versatility means teams can use the same AI-powered environment to model everything from technical architecture to business strategy—without switching tools.
Conclusion: A New Standard in Visual Modeling
The healthcare wearable ecosystem diagram is more than a visualization—it’s a blueprint for innovation. By leveraging the Visual Paradigm AI Chatbot, users can rapidly prototype, refine, and validate complex systems through natural conversation, turning abstract ideas into structured, actionable models.
Whether you’re designing a medical device platform, building a digital health product, or aligning stakeholders across IT and clinical teams, the AI-powered modeling environment ensures clarity, consistency, and depth.
Ready to build your next system model? Explore the shared session and experience how the AI Chatbot transforms your vision into a precise, intelligent model—crafted using the Visual Paradigm AI Chatbot.