


Designing a Smart Agriculture System with AI-Powered Precision
Building a scalable, intelligent agriculture solution requires more than just sensors and data—it demands a clear, structured architecture. The challenge lies in modeling complex interactions between physical devices, data pipelines, decision engines, and human actors like farmers. This is where Visual Paradigm’s AI Chatbot steps in—not as a diagram generator, but as a collaborative modeling expert that translates high-level ideas into precise, standards-compliant models.
From Concept to Diagram: A Conversational Design Journey
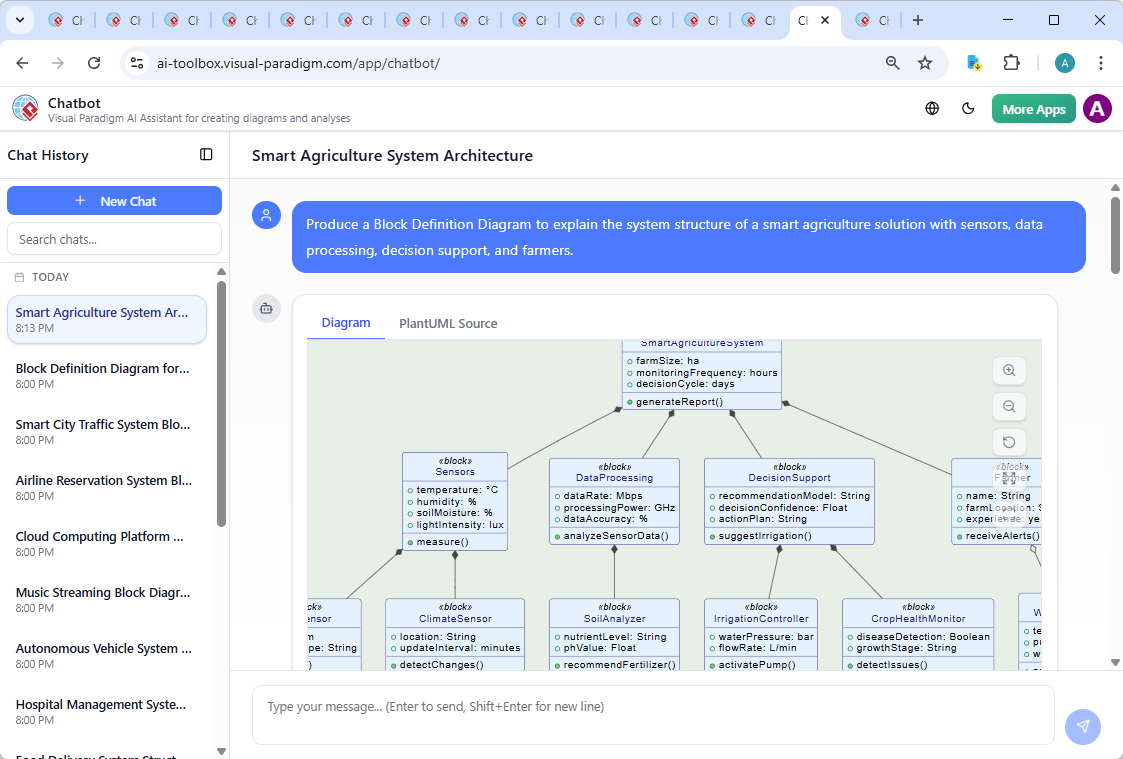
The journey began with a simple request: “Produce a Block Definition Diagram to explain the system structure of a smart agriculture solution with sensors, data processing, decision support, and farmers.” Within seconds, the Visual Paradigm AI Chatbot delivered a fully rendered PlantUML-based Block Definition Diagram (BDD), capturing the core system blocks and their relationships.
But the conversation didn’t stop there. The user followed up: “Can you explain how the SoilAnalyzer block integrates with the DataProcessing block to provide nutrient recommendations?” This wasn’t just a question—it was a design refinement. The AI responded with a detailed, step-by-step breakdown of the data flow, highlighting how raw soil data is validated, contextualized, and transformed into actionable insights.
Each follow-up request—like refining logic, clarifying relationships, or probing integration points—was treated as an opportunity to deepen the model’s accuracy and realism. The AI didn’t just answer; it explained the why behind each block, ensuring the diagram wasn’t just visually correct but architecturally sound.
Understanding the System Logic: Why This Block Definition Diagram Works
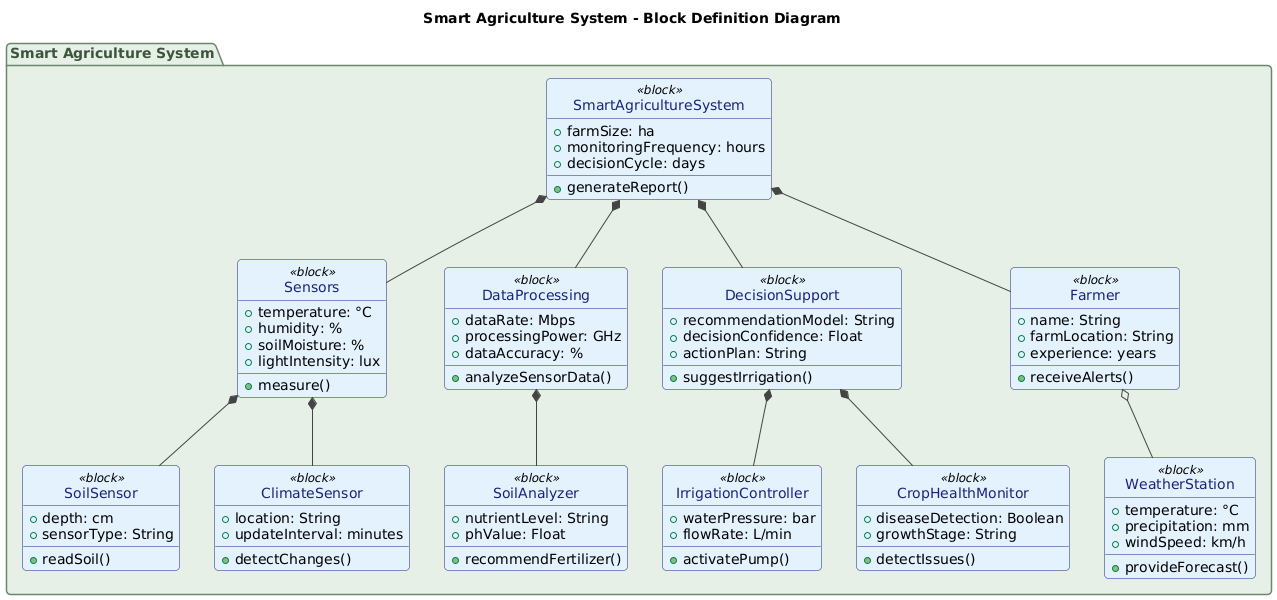
The diagram models the smart agriculture system as a hierarchy of blocks, each representing a distinct functional component. Here’s how each element contributes:
SmartAgricultureSystemacts as the root container, encapsulating all subsystems and defining system-level properties likefarmSize,monitoringFrequency, anddecisionCycle.Sensorsand its sub-blocks (SoilSensor,ClimateSensor) capture real-time environmental data from the field.DataProcessingreceives and validates sensor inputs, cross-references them with historical data, and prepares them for analysis.SoilAnalyzerprovides granular soil nutrient and pH readings—critical for precision farming.DecisionSupportuses processed data to generate recommendations, such as irrigation timing or fertilizer application.Farmeris not just a passive recipient but an active stakeholder, receiving alerts and acting on insights.WeatherStationandCropHealthMonitorenrich the system with external and in-field context, enabling predictive decision-making.
The use of Block Definition Diagram notation is intentional: it defines the static structure of the system, showing how components are grouped, related, and composed. This makes it ideal for system architecture, especially in domains like smart agriculture where clarity between subsystems is essential.
For example, the SoilAnalyzer is not just a standalone block—it’s a sub-component of the broader Sensors group, reflecting its role as a specialized data source. Similarly, the DecisionSupport block connects to IrrigationController and CropHealthMonitor, illustrating how decisions trigger automated or manual actions.
Conversational Intelligence: How the AI Deepened the Design
What sets Visual Paradigm apart is that the AI Chatbot isn’t just generating diagrams—it’s engaging in a design dialogue. When the user asked about the SoilAnalyzer–DataProcessing integration, the AI didn’t give a generic answer. Instead, it:
- Traced the data flow from sensor to decision.
- Highlighted the role of context (crop type, historical yield, weather).
- Explained how validation and anomaly detection happen before recommendations are made.
- Suggested future enhancements, like AI-driven predictive models.
This level of contextual understanding is powered by Visual Paradigm’s deep integration with SysML, UML, and enterprise modeling standards. The AI doesn’t just know how to draw—it understands the semantics of system architecture.
More Than Just BDD: A Unified Modeling Platform
The AI Chatbot isn’t limited to Block Definition Diagrams. It supports a full suite of modeling standards, including:
- UML (for software and system design)
- ArchiMate (for enterprise architecture and business-IT alignment)
- SysML (for systems engineering, including requirements, behavior, and parametric modeling)
- C4 Model (for software architecture at multiple abstraction levels)
- Mind Maps, PERT Charts, Org Charts, SWOT, PEST (for strategic planning and project management)
Whether you’re designing a smart farming system, a cloud migration strategy, or a digital transformation roadmap, the AI Chatbot adapts to your modeling language of choice. It treats every request as a design consultation—offering not just diagrams, but architectural insights.
Conclusion: Smarter Design, Faster Delivery
Creating a smart agriculture system isn’t just about technology—it’s about building a system that works for people, processes, and the environment. With Visual Paradigm’s AI Chatbot, you’re not just generating diagrams; you’re co-designing intelligent systems through a natural, conversational workflow.
From the initial prompt to the refined integration explanation, every step was guided by AI intelligence, structured clarity, and domain expertise. The result? A robust, extensible architecture that can evolve with real-world data and future innovations.
Ready to model your next system with the same level of precision? Try the shared session and experience the future of visual modeling.