

Modeling Real-Time Healthcare Intelligence: A SysML Internal Block Diagram for Patient Monitoring
Designing a robust patient monitoring system requires more than just hardware integration—it demands a clear, scalable, and maintainable model of how data flows from sensors to clinical decision points. The challenge lies in visualizing complex interactions across physical devices, signal processing layers, analytical logic, and user interfaces—all while ensuring accuracy and compliance.
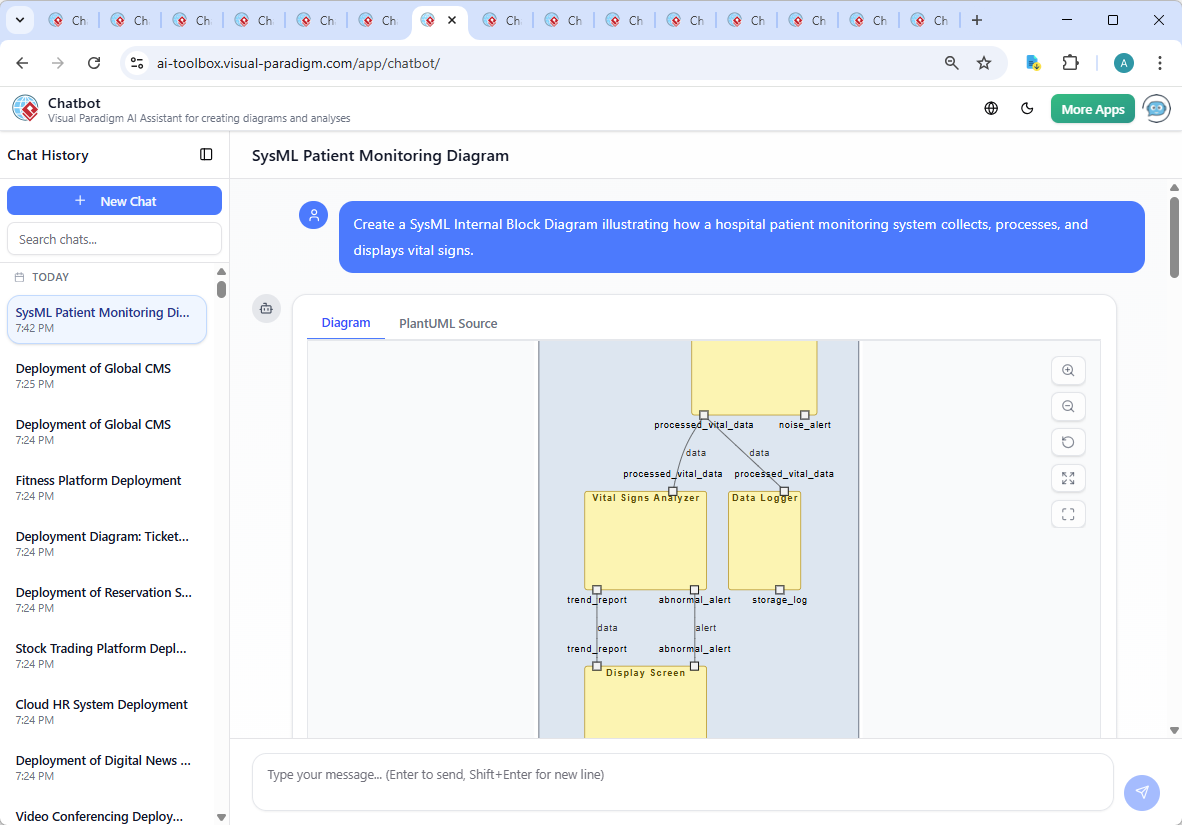
Enter the Visual Paradigm AI Chatbot, your collaborative modeling partner. Instead of starting from scratch or wrestling with syntax, you simply describe your intent: “Create a SysML Internal Block Diagram illustrating how a hospital patient monitoring system collects, processes, and displays vital signs.” Within seconds, the AI generates a precise, production-ready IBD—crafted using the Visual Paradigm AI Chatbot and grounded in SysML standards.
From Prompt to Precision: The Interactive Evolution of the Diagram
The journey began with a single, clear request. The AI responded with a fully formed PlantUML-based Internal Block Diagram (IBD), immediately capturing the system’s structure and data flow. But the real value emerged not in the initial output—but in the conversation that followed.
When the user asked, “Explain this diagram,” the AI didn’t just list components. It delivered a context-rich, clinical-grade breakdown, mapping each component to real-world functionality and explaining why certain data flows were designed the way they were. This wasn’t a static diagram—it was a living model with embedded rationale.
For instance, the AI highlighted how the hospital bed contributes contextual data (like patient position) that improves the interpretation of vital signs—a subtle but critical insight often missed in basic system designs. When asked to refine the logic, the AI responded with targeted suggestions: “Would you like to add error handling for signal dropout?” or “Should the analyzer include threshold-based alerting logic?” These weren’t random suggestions—they were intelligent follow-ups based on domain expertise.
Each round of conversation deepened the model’s fidelity, turning a simple visualization into a decision-support-ready architecture.
Inside the System: A Deep Dive into the IBD Logic
The generated SysML Internal Block Diagram is more than a flowchart—it’s a structured representation of system behavior, built around three core principles: modularity, data integrity, and traceability.
Component Roles and Data Flow
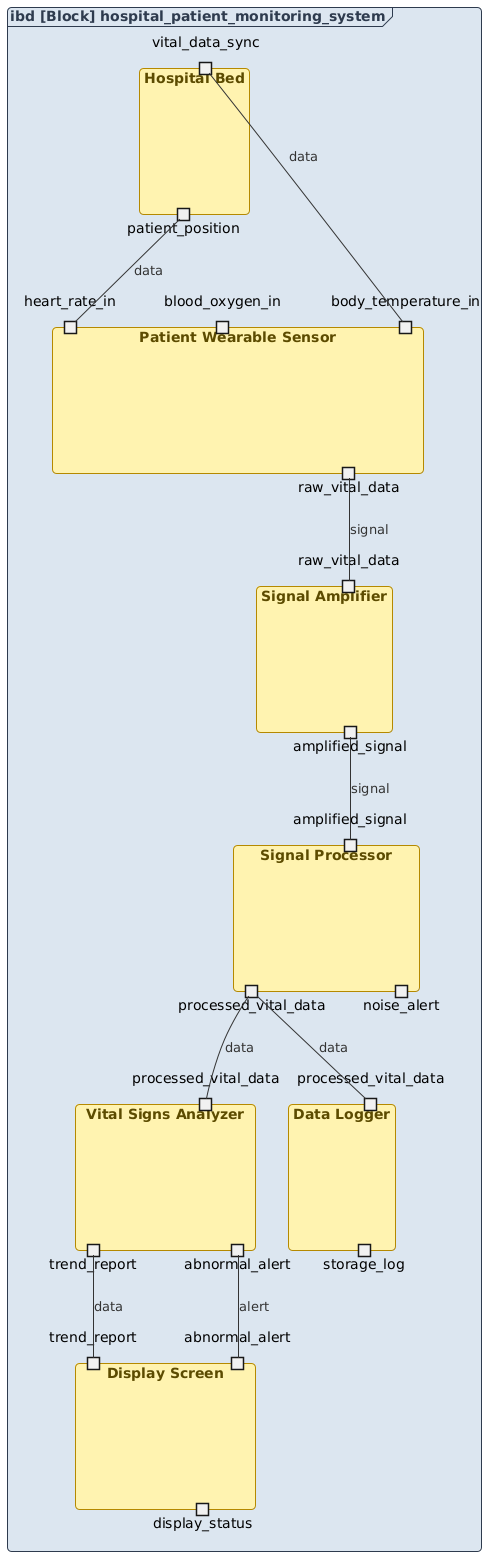
- Patient Wearable Sensor: The system’s first point of contact. It captures raw vital signs—heart rate, blood oxygen, and body temperature—via embedded sensors. Its ports are defined to handle input signals and output raw data.
- Signal Amplifier: Receives weak analog signals and boosts them for reliable transmission. This step is essential in preventing data loss due to signal degradation.
- Signal Processor: Filters out electrical noise and converts analog signals into digital format. It also generates a
noise_alertport to flag potential sensor malfunctions. - Vital Signs Analyzer: Applies algorithms to detect trends and anomalies. It produces two key outputs:
trend_reportfor longitudinal tracking andabnormal_alertfor urgent clinical intervention. - Display Screen: The human interface. It receives both trend data and alerts, enabling real-time monitoring by medical staff.
- Data Logger: Stores all processed data securely for compliance, audit, and research purposes. This ensures traceability over time.
- Hospital Bed: Acts as a contextual layer. It provides patient position data (e.g., lying down vs. sitting), which helps the system adjust interpretation of vital signs—such as distinguishing between true hypoxia and posture-related readings.
Why Internal Block Diagram (IBD)?
Unlike simple component diagrams, an IBD in SysML explicitly defines the internal structure of a system, showing how components are connected through ports and flows. This is ideal for a monitoring system where:
- Signal integrity must be preserved across stages.
- Feedback loops (e.g., alert → response → logging) need to be traceable.
- Modular design allows for future upgrades (e.g., adding EEG or ECG support).
The use of portin and portout ensures that interface contracts are clear, reducing ambiguity during implementation.
The Power of Conversational Design: AI as Your Modeling Consultant
What sets Visual Paradigm apart is not just the diagram generation—but the intelligence behind the conversation. The AI doesn’t just generate code; it thinks like a systems architect.
When the user requested an explanation, the AI didn’t stop at naming components. It connected the dots between technical design and clinical impact—highlighting how early anomaly detection can reduce patient risk, how logging supports regulatory compliance, and how contextual data improves diagnostic accuracy.
Further refinements were proposed on-demand: “Would you like to add a secure data transmission layer?” or “Should the analyzer support configurable thresholds?” These weren’t generic suggestions—they were domain-aware, actionable improvements.
Beyond SysML: A Unified Platform for Enterprise Architecture
While this example focused on SysML, the Visual Paradigm AI Chatbot is not limited to one standard. It seamlessly supports a full suite of modeling languages, including:
- UML: For software design and system behavior modeling.
- ArchiMate: For enterprise architecture, mapping business goals to IT capabilities.
- C4 Model: For software architecture at the context, container, component, and code levels.
- SWOT, PEST, Org Charts, Mind Maps, PERT Charts: For strategic planning, organizational modeling, and project scheduling.
This versatility means that whether you’re designing a medical device, mapping an enterprise IT landscape, or planning a digital transformation, the same AI-powered platform delivers consistent, accurate modeling—no context switching, no learning curves.
Conclusion: A Smarter Way to Model Complex Systems
Creating a patient monitoring system isn’t just about wiring sensors and displaying data. It’s about building a resilient, intelligent, and maintainable system that supports real-time care and long-term analysis.
With Visual Paradigm’s AI Chatbot, you’re not just generating diagrams—you’re co-creating a model with an expert partner. The conversation isn’t a one-way handoff; it’s a collaborative design session where every question deepens the model’s value.
Ready to bring your next system to life? Try the shared session and see how the AI Chatbot transforms your ideas into precise, actionable models—crafted using the Visual Paradigm AI Chatbot.