


Designing the Future: A Collaborative Journey to Launching a New Automobile Model
Launching a new automobile model is a complex, multi-phase endeavor that demands precision, coordination, and strategic planning. From concept to showroom, every step must be sequenced with care to avoid costly delays and ensure quality. The challenge lies not just in executing tasks, but in visualizing their dependencies, timelines, and resource flows across engineering, manufacturing, and marketing teams.
Enter the Visual Paradigm AI Chatbot — not just a diagram generator, but a conversational modeling expert. By transforming natural language into structured, intelligent visual models, it empowers teams to design, refine, and validate project workflows in real time. In this article, we walk through how the AI Chatbot helped craft a detailed PERT chart for launching a new automobile model — from initial request to deep-dive analysis — all through a dynamic, collaborative dialogue.
From Request to Insight: The Interactive Journey of Model Creation
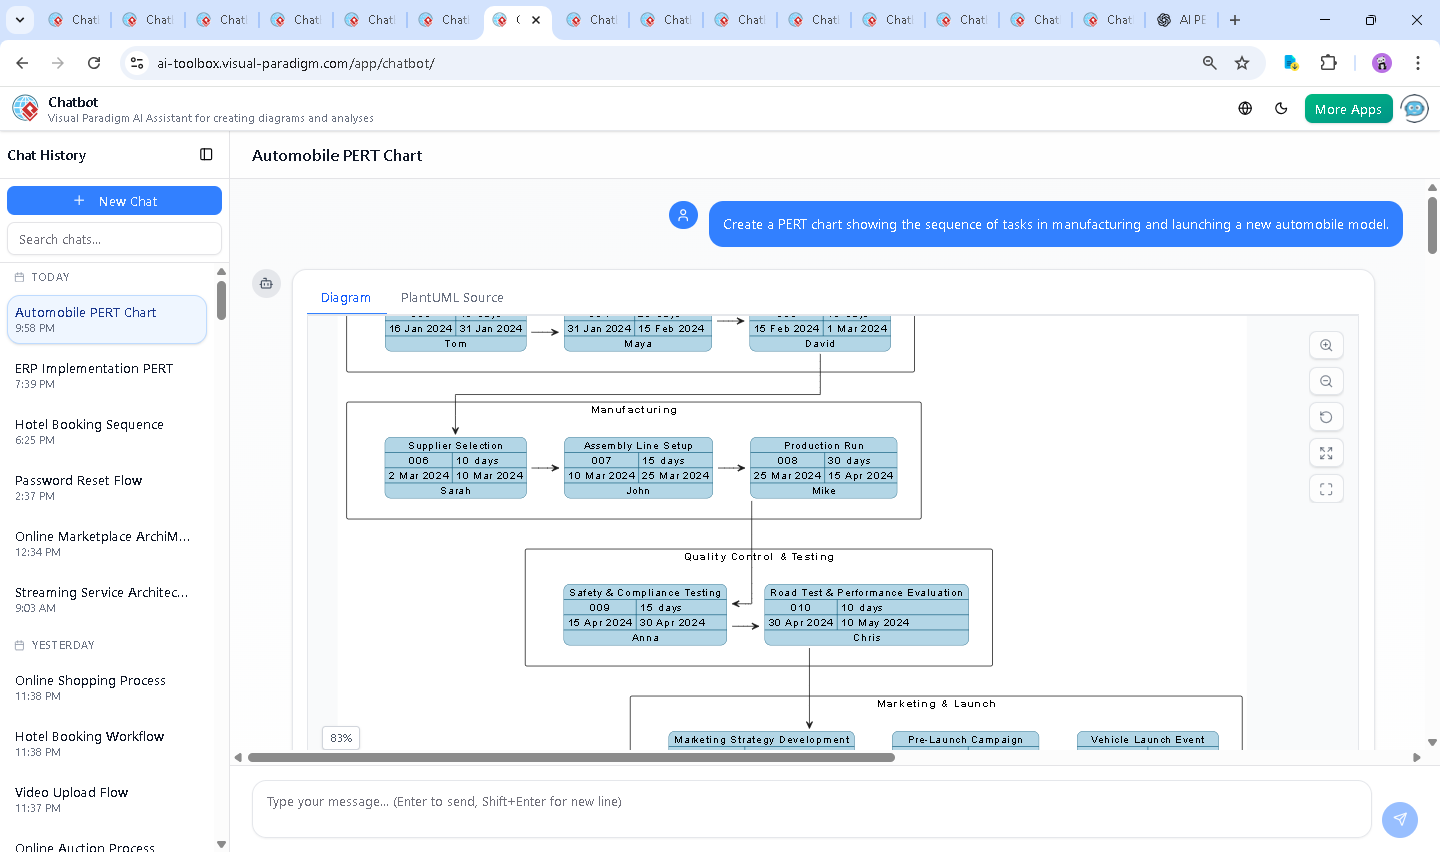
The journey began with a simple prompt: “Create a PERT chart showing the sequence of tasks in manufacturing and launching a new automobile model.” Within seconds, the AI Chatbot responded with a fully structured PlantUML script, generating a PERT chart with five distinct phases, each containing time-bound tasks, responsible roles, and clear dependencies.
But the conversation didn’t stop there. When the user asked, “Explain this diagram,” the AI didn’t just restate the data — it interpreted the structure, broke down each phase, and revealed the project’s critical path. It highlighted that the longest sequence — from market research to launch event — spans 178 days, making it the project’s lifeline.
Further follow-ups like “Refine the logic” or “Explain this branch” triggered deeper analysis. For instance, the AI clarified why prototype testing must precede supplier selection: because the final design dictates component specifications, which in turn guide supplier selection. This isn’t just diagramming — it’s modeling with intent, guided by domain expertise.
Each interaction demonstrated the AI’s ability to act as a modeling consultant, not just a tool. It anticipated questions, provided context, and offered actionable insights — all while maintaining alignment with project management best practices.
The PERT Chart in Action
Decoding the Logic: Why This PERT Chart Works
The generated PERT chart is more than a timeline — it’s a strategic blueprint. Let’s break down its core logic:
1. Phased Structure with Clear Dependencies
Tasks are grouped into five logical lanes:
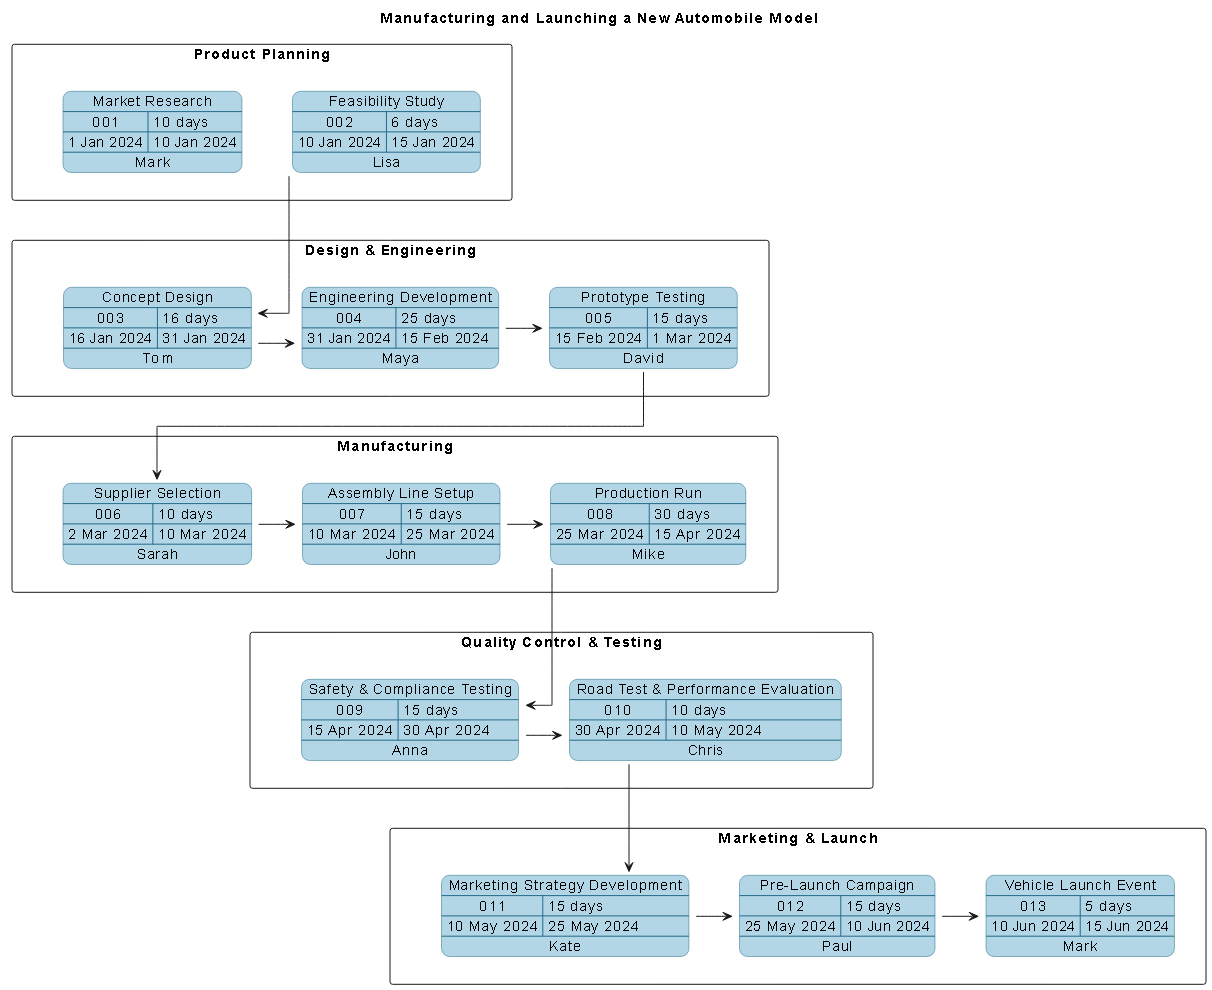
- Product Planning (Market Research → Feasibility Study)
- Design & Engineering (Concept → Engineering → Prototype Testing)
- Manufacturing (Supplier Selection → Assembly Setup → Production Run)
- Quality Control & Testing (Safety → Road Test)
- Marketing & Launch (Strategy → Pre-Launch → Launch Event)
Each task is linked via $dependency() calls, ensuring that no phase begins prematurely. For example, $dependency(task05, task06) enforces that supplier selection cannot start until prototype testing is complete — a critical safeguard in real-world manufacturing.
2. Realistic Timeframes and Responsible Ownership
Every task includes:
- Start and end dates (e.g., Concept Design: 16 Jan – 31 Jan 2024)
- Duration in days (e.g., 16 days)
- Responsible team member (e.g., Tom, Maya, Sarah)
This level of detail enables accountability and resource planning. Project managers can instantly identify who is responsible for what and when.
3. Critical Path Identification
The AI explicitly traced the critical path:
Market Research → Feasibility Study → Concept Design → Engineering Development → Prototype Testing → Supplier Selection → Assembly Line Setup → Production Run → Safety & Compliance Testing → Road Test → Marketing Strategy → Pre-Launch Campaign → Launch EventWith a total duration of 178 days, this path determines the project’s minimum completion time. Any delay here directly impacts the launch date — a key insight for risk management.
4. Strategic Insights from the Structure
The chart reveals three critical observations:
- Design & Engineering is the longest phase (46 days), indicating high complexity and resource demand.
- Manufacturing spans 55 days (setup + production), highlighting logistics and supply chain challenges.
- Marketing starts late (May), meaning the product must be fully validated by then — a tight window.
These insights aren’t just data points — they’re strategic signals for decision-makers.
Conversational Intelligence: The AI as Your Modeling Partner
What sets Visual Paradigm apart is how the AI Chatbot evolves with the user. After the initial PERT chart was generated, the conversation deepened with targeted follow-ups:
- “Explain this diagram” → The AI delivered a structured breakdown with phase summaries, timelines, and risk highlights.
- “Refine the logic” → The AI clarified dependency rationale, such as why prototype testing must precede supplier selection.
- “What can I do with this?” → The AI suggested next steps: Gantt chart export, risk flagging, or buffer adjustments.
These interactions prove the AI isn’t just generating visuals — it’s thinking alongside the user, adapting to feedback, and enriching the model with contextual intelligence.
Beyond PERT: A Unified Modeling Platform
The Visual Paradigm AI Chatbot isn’t limited to PERT charts. It supports a full spectrum of modeling standards, including:
- UML (for software and system design)
- ArchiMate (for enterprise architecture and business modeling)
- SysML (for systems engineering and requirements analysis)
- C4 Model (for software architecture and context diagrams)
- Mind Maps, Org Charts, SWOT, PEST, and data visualization (e.g., column, pie, line, area charts)
This versatility makes Visual Paradigm a complete, AI-powered visual modeling platform — one that evolves with your project, whether you’re designing a car, a digital service, or a corporate strategy.
Conclusion: From Concept to Launch, Powered by AI
Launching a new automobile model is no small feat. It requires coordination across engineering, manufacturing, quality, and marketing — all under tight timelines. The PERT chart generated through the Visual Paradigm AI Chatbot delivers more than a timeline: it offers a living model of the project’s journey, with clear dependencies, accountability, and risk visibility.
What makes this possible is the AI’s ability to act as a collaborative expert — interpreting intent, refining logic, and delivering insights in real time. Whether you’re a project manager, architect, or product lead, the platform turns abstract ideas into precise, actionable visual models.
Ready to build your next project model? Start with a simple prompt and let the AI guide you — because the future of modeling isn’t just visual. It’s conversational, intelligent, and built for real-world impact.