
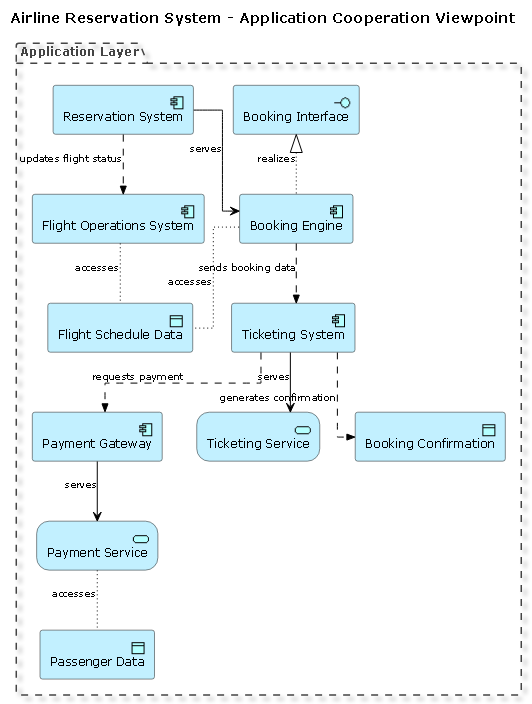
AI Generated ArchiMate Diagram: Airline Reservation System Example
Produce an ArchiMate Diagram that visualizes an airline reservation system managing flight bookings, ticketing, payment, and operational systems.
Diagram Type: ArchiMate Diagram
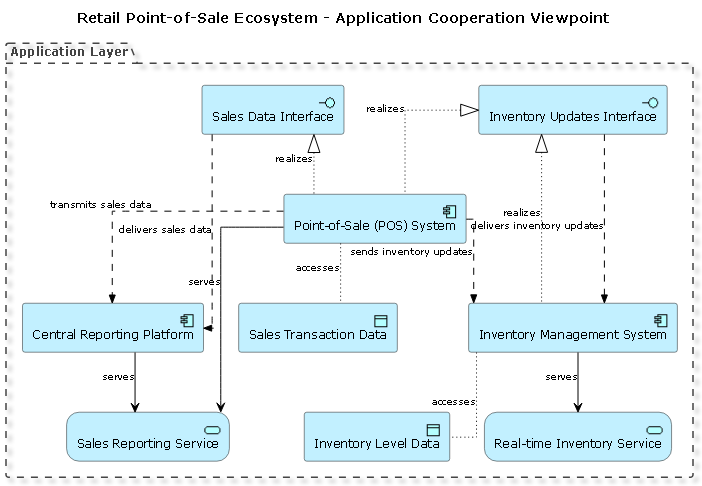
AI Generated ArchiMate Diagram: Retail Point-of-Sale Ecosystem Example
Generate an ArchiMate Diagram representing a retail point-of-sale ecosystem linking stores, inventory systems, and central reporting platforms.
Diagram Type: ArchiMate Diagram
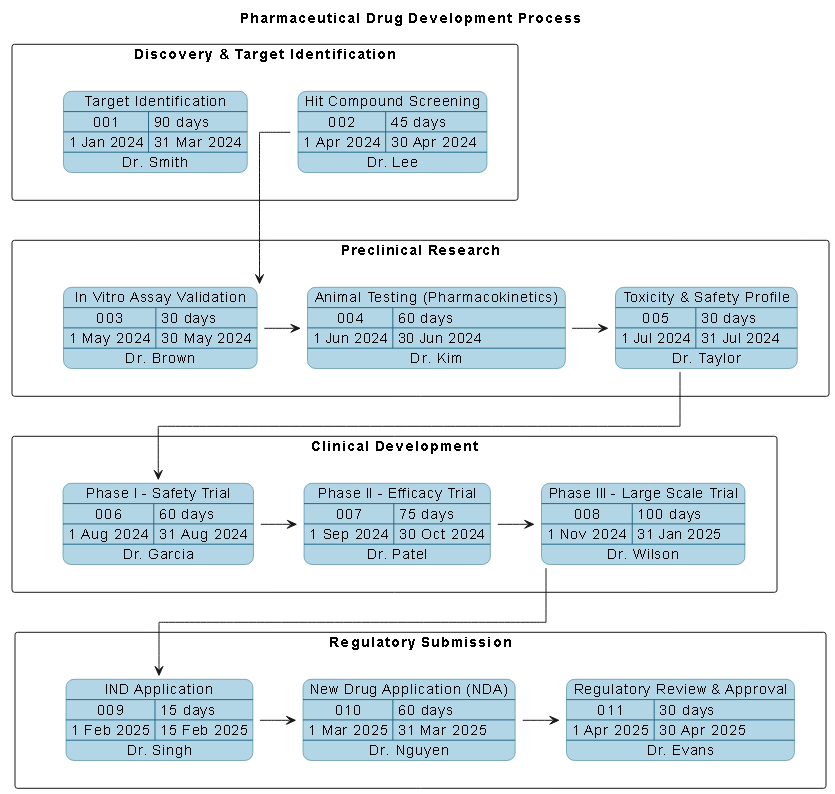
AI Generated PERT Chart: Pharmaceutical Drug Development Process Example
Create a PERT chart to map the phases of developing a new pharmaceutical drug from research to regulatory approval.
Diagram Type: PERT Chart
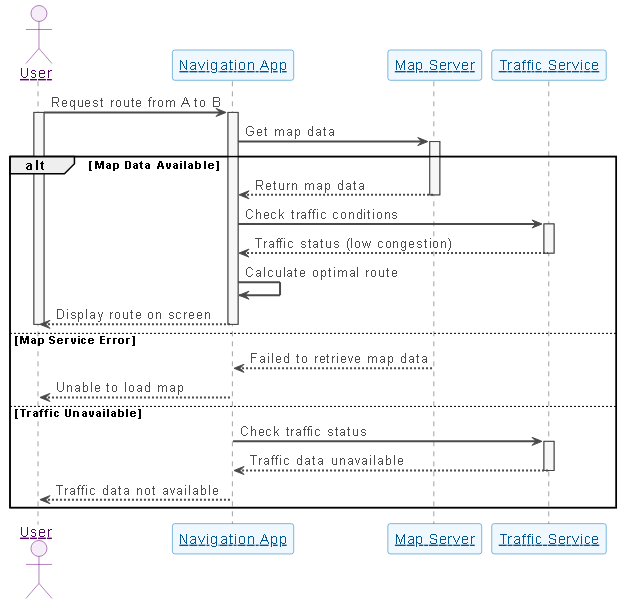
AI Generated Sequence Diagram: Online Payment Processing System Example
Draw a sequence diagram showing how a navigation app calculates and displays a route.
Diagram Type: Sequence Diagram
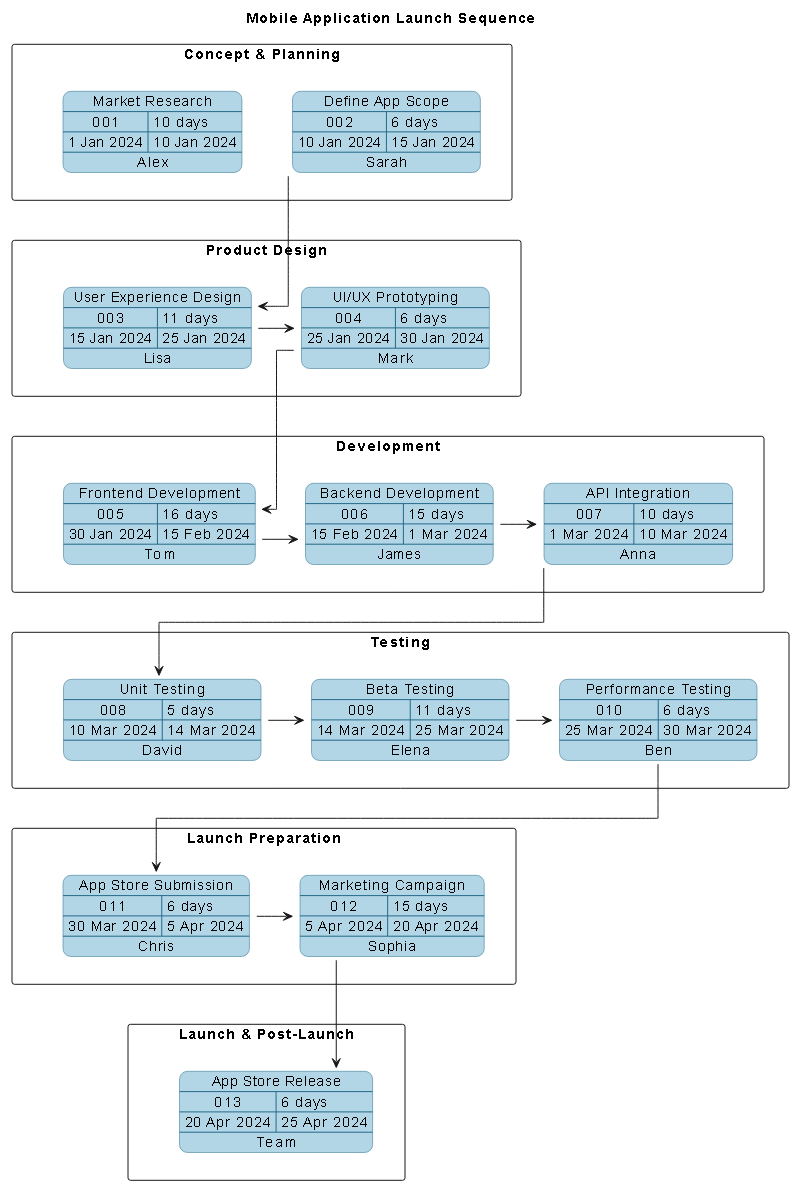
AI Generated PERT Chart: Mobile Application Launch Sequence Example
Generate a PERT chart to visualize the sequence and dependencies involved in developing and launching a new mobile application from concept to app store release.
Diagram Type: PERT Chart
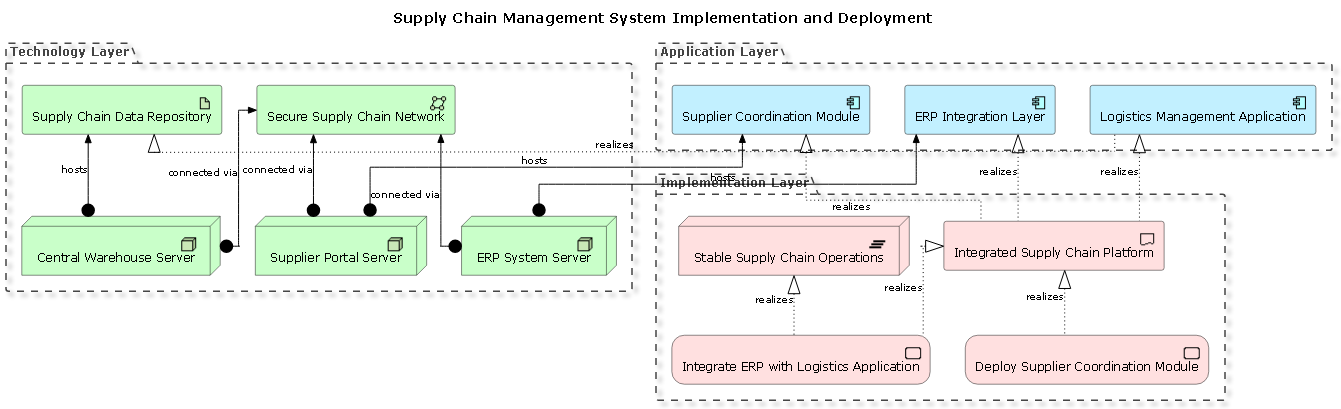
AI Generated ArchiMate Diagram: Supply Chain Management System Implementation and Deployment Example
Create an ArchiMate Diagram describing a supply chain management system coordinating suppliers, warehouses, logistics applications, and ERP systems.
Diagram Type: ArchiMate Diagram
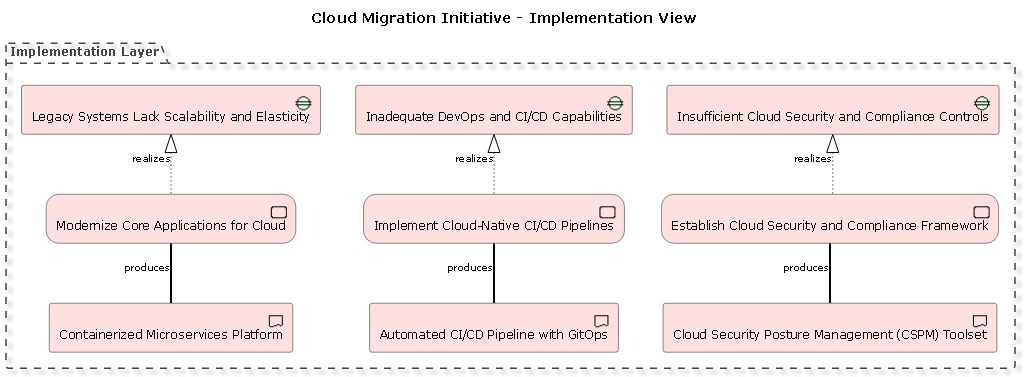
AI Generated ArchiMate Diagram: Cloud Migration Initiative Example
Produce an ArchiMate Diagram that represents a cloud migration initiative transitioning legacy enterprise systems to scalable cloud services.
Diagram Type: ArchiMate Diagram
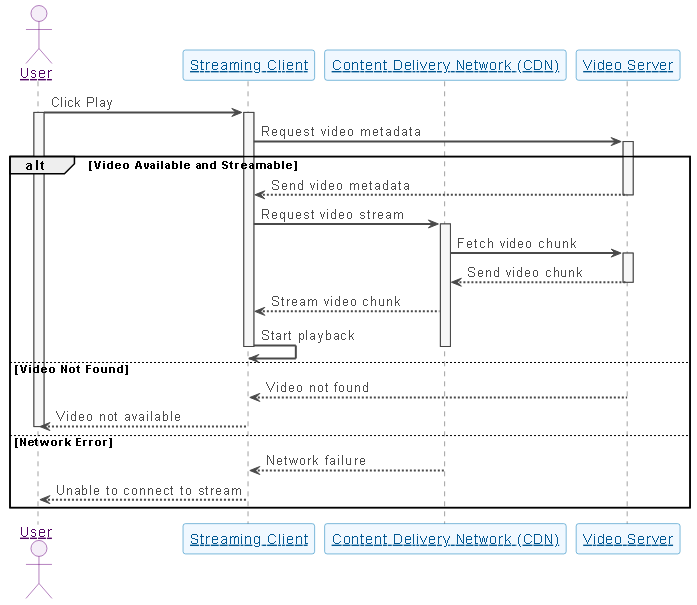
AI Generated Sequence Diagram: Online Payment Processing System Example
Create a sequence diagram that explains how a video streaming platform starts playback when a user clicks play.
Diagram Type: Sequence Diagram
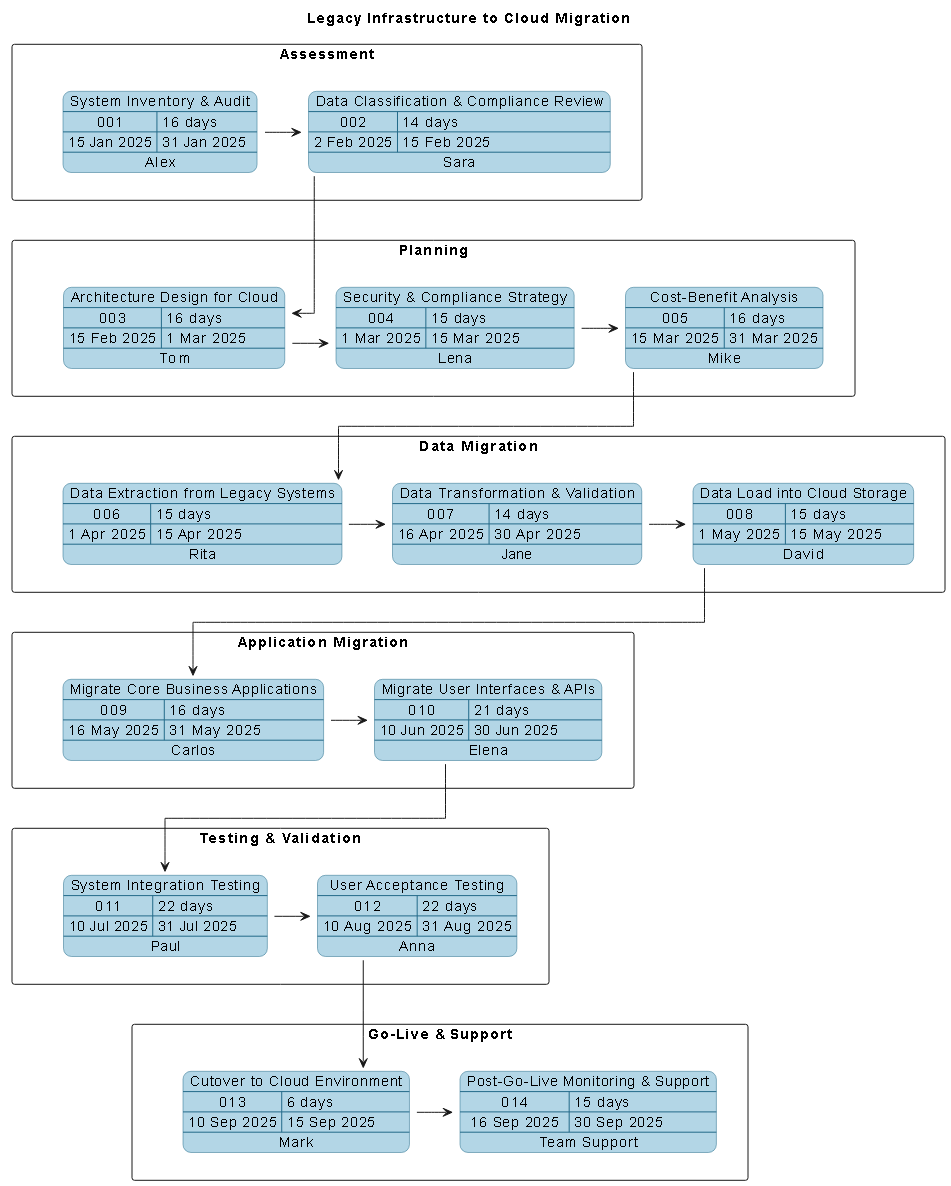
AI Generated PERT Chart: Legacy Infrastructure to Cloud Migration Example
Produce a PERT chart describing the dependencies in upgrading a legacy IT infrastructure to cloud-based systems.
Diagram Type: PERT Chart