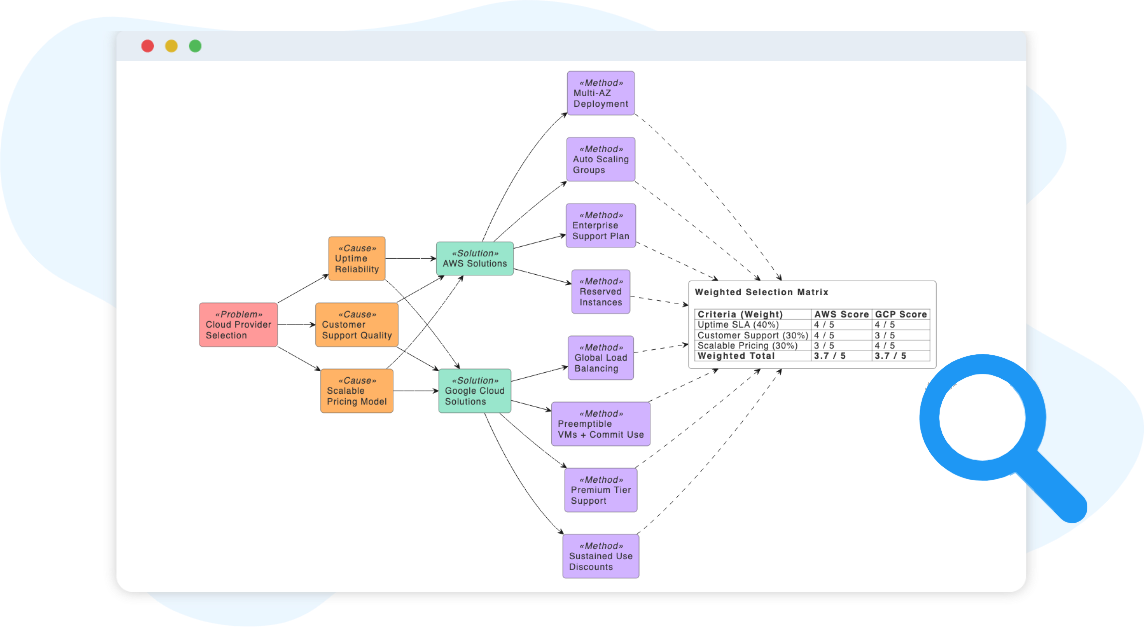
Solution Selection Matrix Diagram
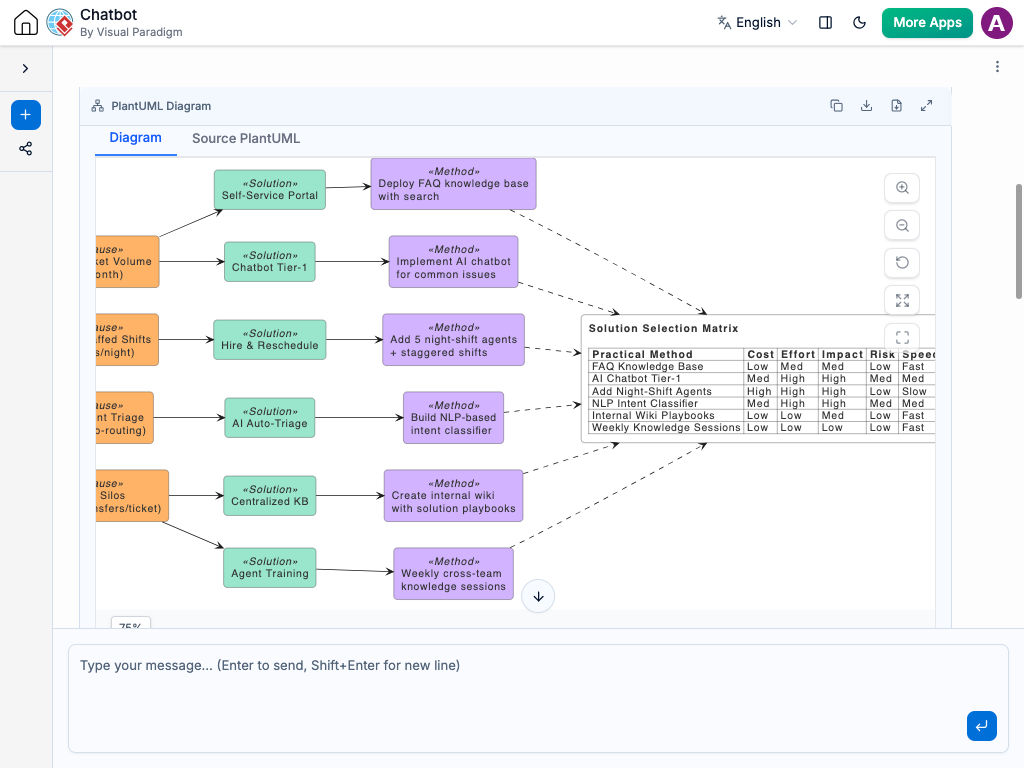
Instant Solution Selection Matrix Creation
With the AI chatbot, connecting abstract brainstorming to practical execution becomes much easier. Instead of jumping between disconnected whiteboard mind maps, cause-and-effect shapes, and messy spreadsheets, you can simply describe your business roadblock in plain language.
The chatbot automatically translates your challenge into a structured 4-tier hierarchy chart that instantly links to an embedded evaluation matrix. Whether you are mapping out complex supply chain delays or solving customer retention rates, the AI handles the data tracking and shape generation for you.
Trace Your Decisions Through Conversation
Strategic frameworks are rarely static on the first try, so the AI lets you refine your root causes and methods through chat. You can ask the AI to:
Add a hidden cause: “What if our slow delivery times are actually caused by low warehouse staffing?”
Suggest tactical solutions: “Give me three fast methods to improve our app’s checkout speed.”
Adjust an evaluation: “Change the speed rating for our customer alerts app method from Medium to Fast.”
The entire diagram updates instantly through VPasCode, automatically listing your tactical methods as spreadsheet-like rows mapped against standard criteria. This conversational approach prevents “solution jumping”—ensuring every single action your team takes can be traced directly back to a real root cause.


Strict 4-Tier Logic Mapping: Automatically builds a clear structural path from the root problem down to causes, strategic solutions, and actionable methods.
True End-to-End Tracking: Connects every final action item visually back to the specific root cause it is designed to fix.
Standardized Evaluation Board: Dynamically lists your execution methods against standard tracking metrics like Cost, Effort, Impact, Risk, and Speed.
Color-Coded Visual Hierarchy: Uses precise color identifiers (Pink, Orange, Green, Purple) so stakeholders can parse structural tiers at a glance.
VPasCode Integration: Opens directly into a diagram-as-code space using PlantUML syntax, giving you instant textual editing power.
Actionable “Take Action” Filter: Helps you instantly isolate immediate tactical wins (Yes/No filters) from low-value, high-cost burdens.
Examples of Generating Solution Selection Matrices
SaaS Customer Churn Analysis
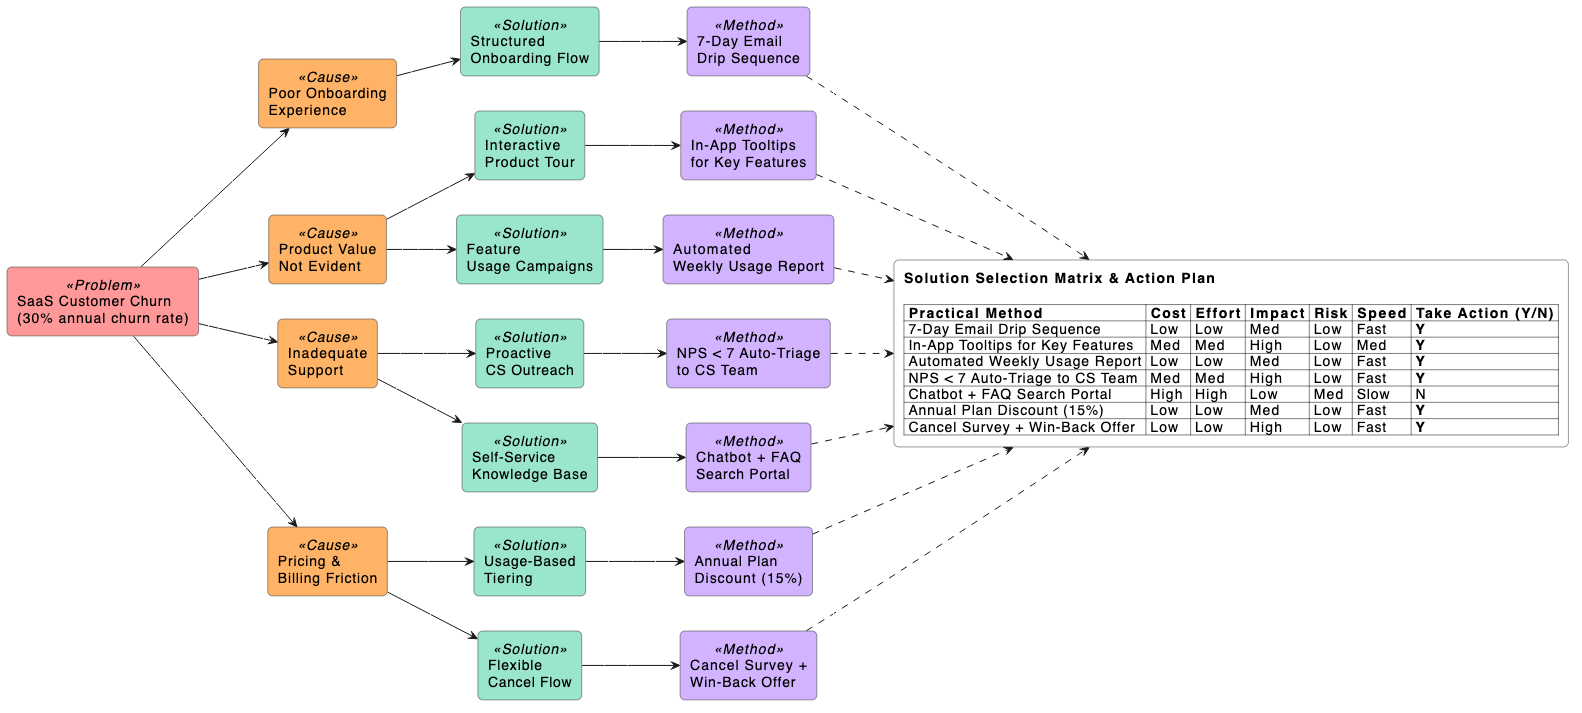
“Create a solution selection matrix for reducing customer churn in a SaaS business, tracking root causes to tactical fixes.”
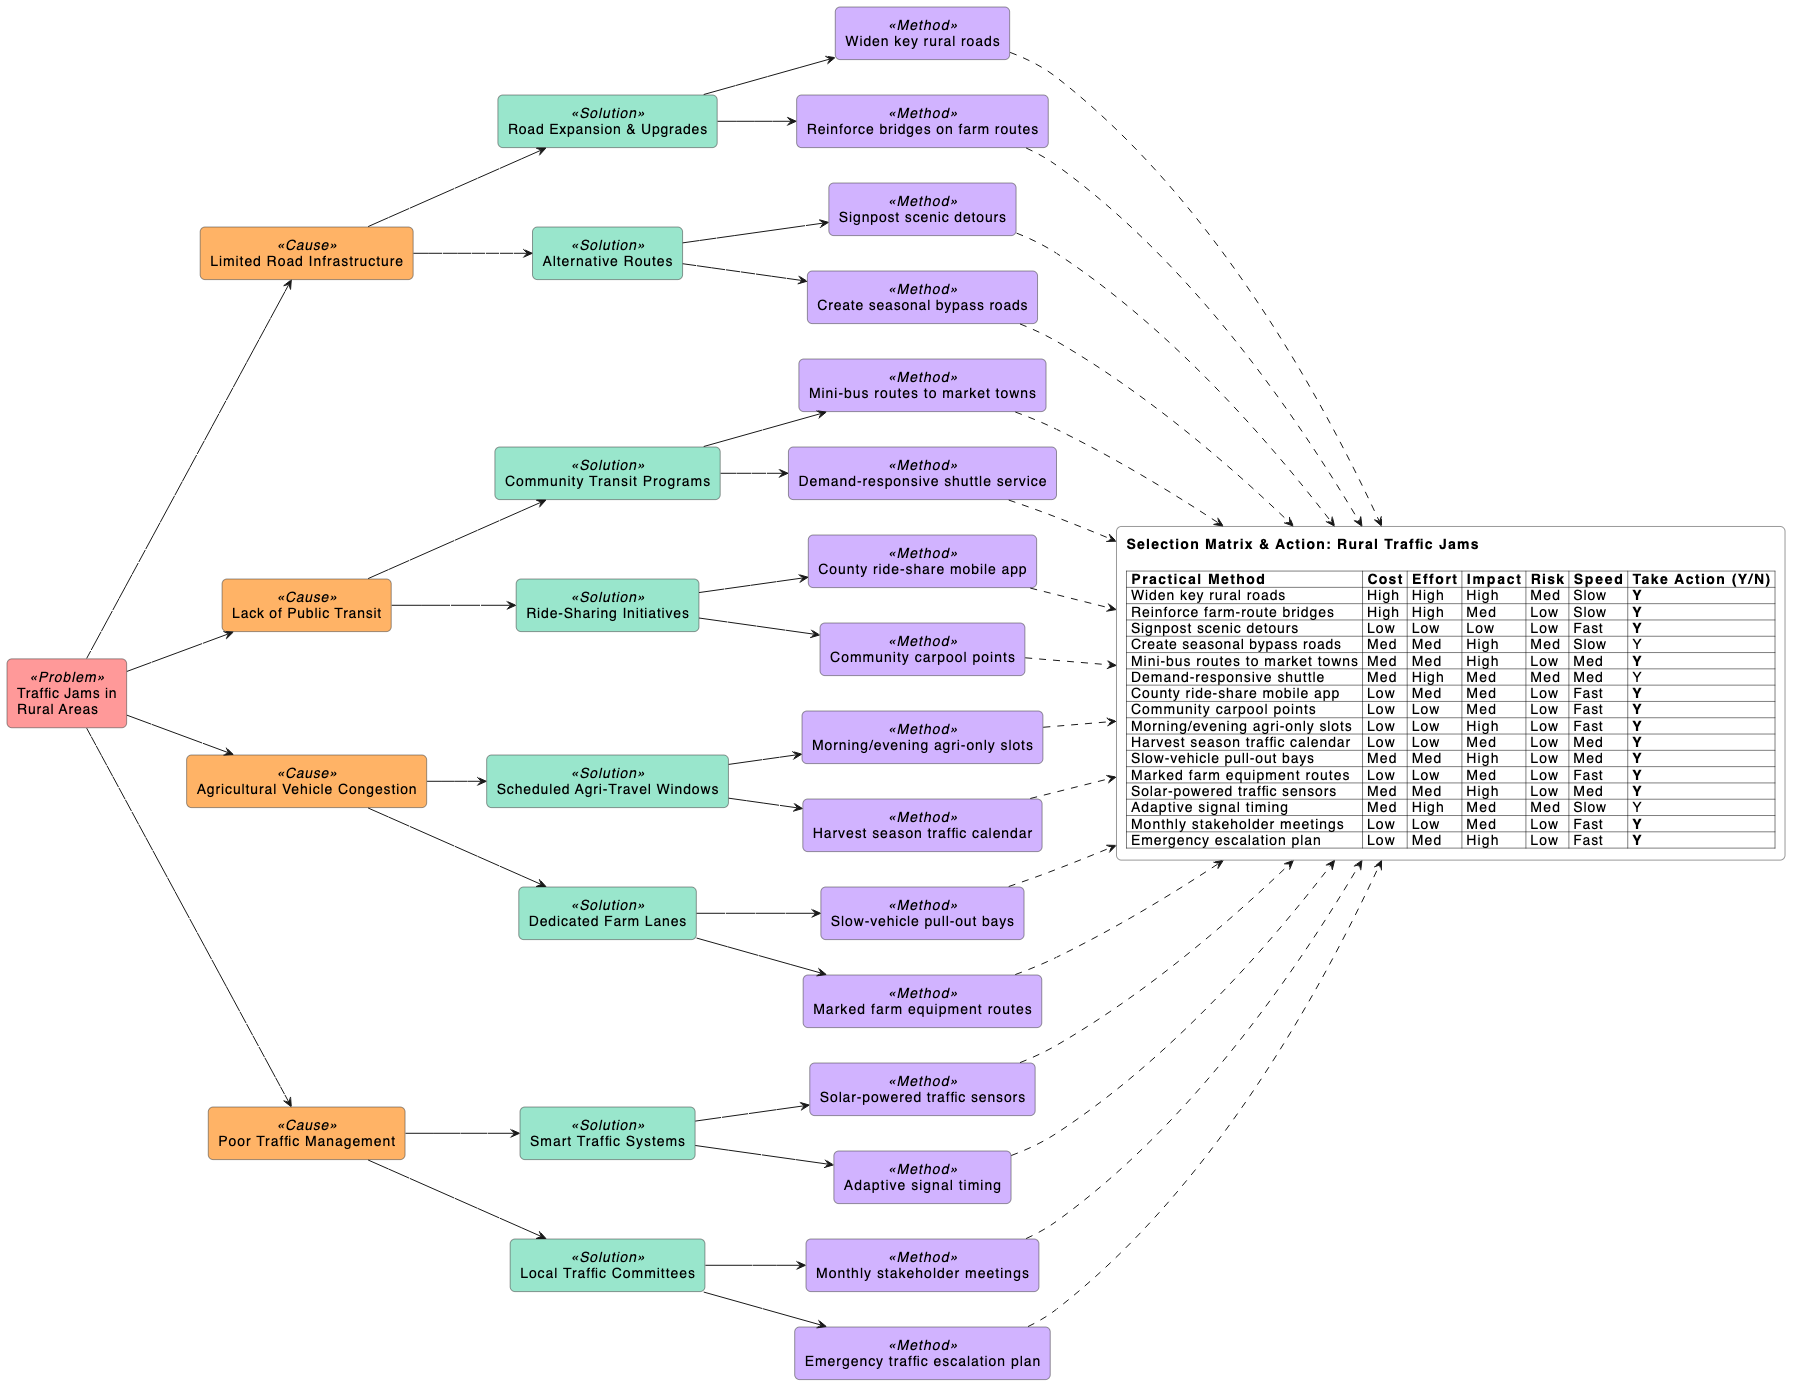
“Generate a Solution Selection Matrix to identify root causes and practical solutions to the problem of traffic jams in rural areas.”
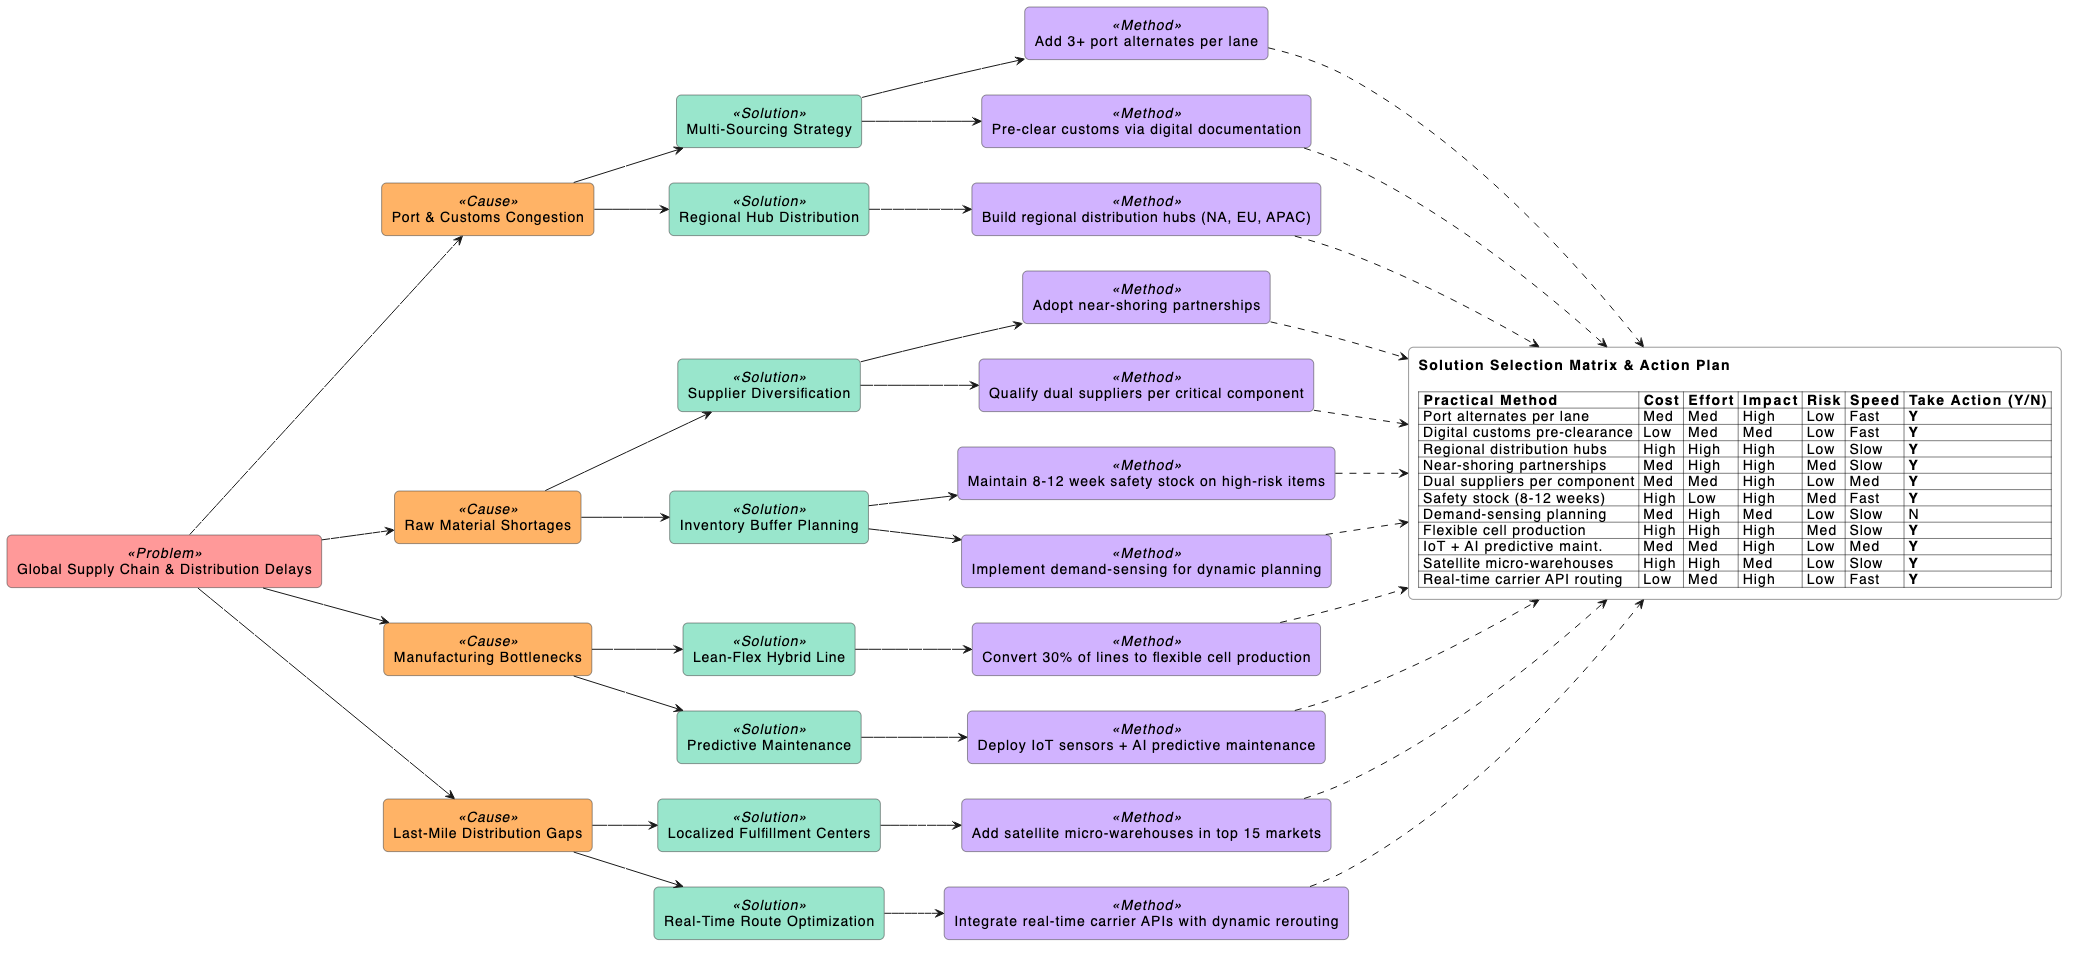
“Generate a solution selection matrix for managing global product distribution and manufacturing supply chain delays.”
What Is a Solution Selection Matrix?
A Solution Selection Matrix is a comprehensive strategic framework designed to bridge the gap between Root Cause Analysis (RCA) and execution. Unlike traditional fishbone charts that stop at identifying why a problem occurs, this tool maps out the precise, measurable actions required to fix those causes efficiently.
The 4 Structural Levels of Your Matrix Map:
Level 1: The Problem (Pink): The central core issue or negative business metric requiring team intervention. (Example: High Shopping Cart Abandonment Rate)
Level 2: The Causes (Orange): The underlying operational forces driving why that specific problem exists. (Example: Slow Page Load Times)
Level 3: The Solutions (Green): High-level operational strategies designed to counteract or eliminate each cause. (Example: Optimize Media Assets)
Level 4: The Practical Methods (Purple): Granular, tactical implementation steps that carry out the strategy. (Example: Compress PNGs to WebP)
The Embedded Evaluation Criteria
Once your 4-tier flow is drawn, every tactical execution method (Level 4) is automatically populated into an evaluation grid to be weighed across six standard metrics:
Cost: The financial capital investment required (High/Med/Low).
Effort: The internal man-hours and logistical resource complexity (High/Med/Low).
Impact: The expected direct improvement on the main core Problem metric (High/Med/Low).
Risk: The potential for negative operational side effects or execution failure (High/Med/Low).
Speed: The implementation timeframe or overall time-to-value (Fast/Med/Slow).
Take Action: The definitive strategic decision to greenlight the path forward (Yes/No).