


UML Class Diagram
The UML Class Diagram defines the structure of a system by depicting classes, their attributes, methods, and relationships.
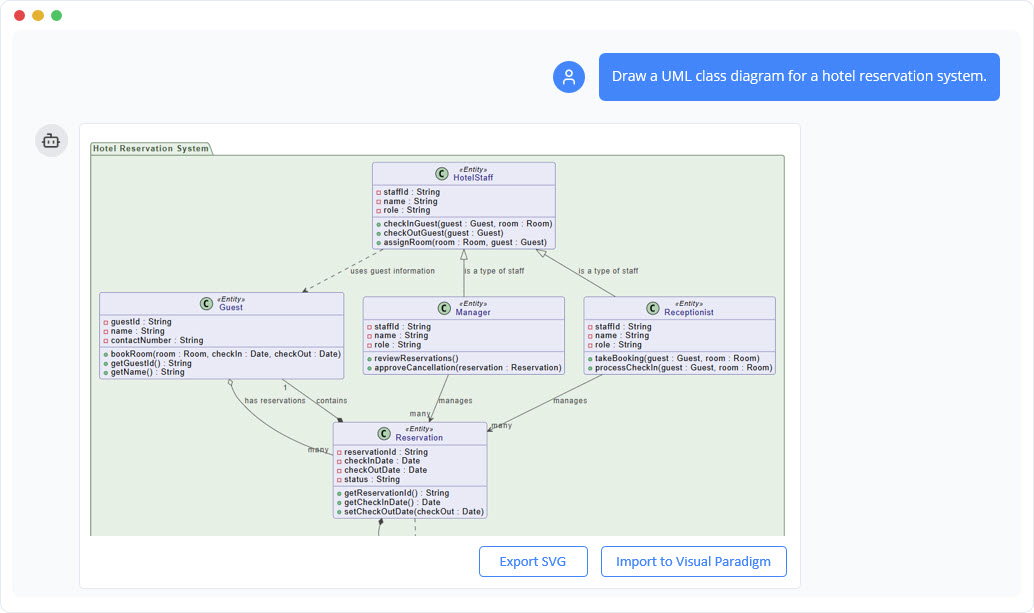
Instant Class Diagram Creation
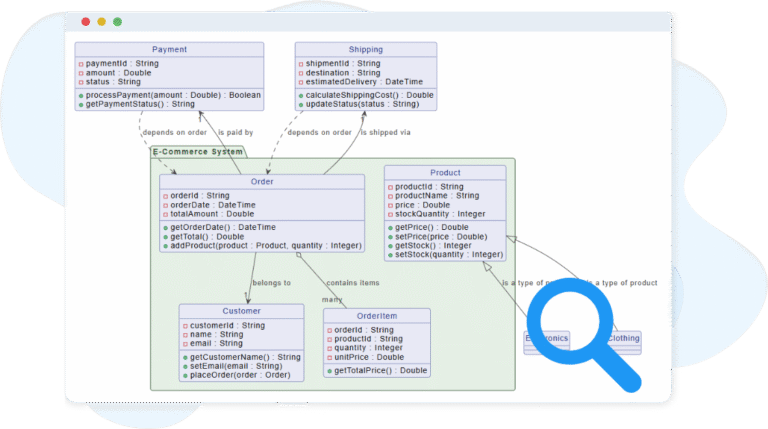
Creating a UML Class Diagram becomes effortless with the AI Chatbot. Just describe your system—such as “Create a class diagram for an online shopping system with Customer, Product, Order, and Payment”—and the AI instantly generates a clean, UML-compliant diagram. You skip the manual layout work and start directly with a clear, structured model.
Refine and Explore Through Conversation
You can then refine the diagram through simple conversations. Ask the chatbot to add relationships, update attributes, or introduce inheritance, and it adjusts the diagram instantly. You can also request guidance, such as identifying missing classes or suggesting improvements, turning the chatbot into both a modeling tool and an analytical assistant.

Benefits of Creating Class Diagrams with the AI Chatbot
Generate UML-standard diagrams instantly without manual drawing.
Refine classes, attributes, and relationships using simple text commands.
Receive smart suggestions to improve structure and identify missing components.
Turn your diagram into documentation or further analysis with one request.
Focus on design logic while the AI handles layout, formatting, and updates.
Examples of Generating UML Class Diagram
Use simple text prompts to generate this diagram in seconds. Here are a few examples to get you started:
Fitness Tracking Application
“Generate a class diagram for a Fitness Tracking Application. “
Healthcare Appointment Scheduling System
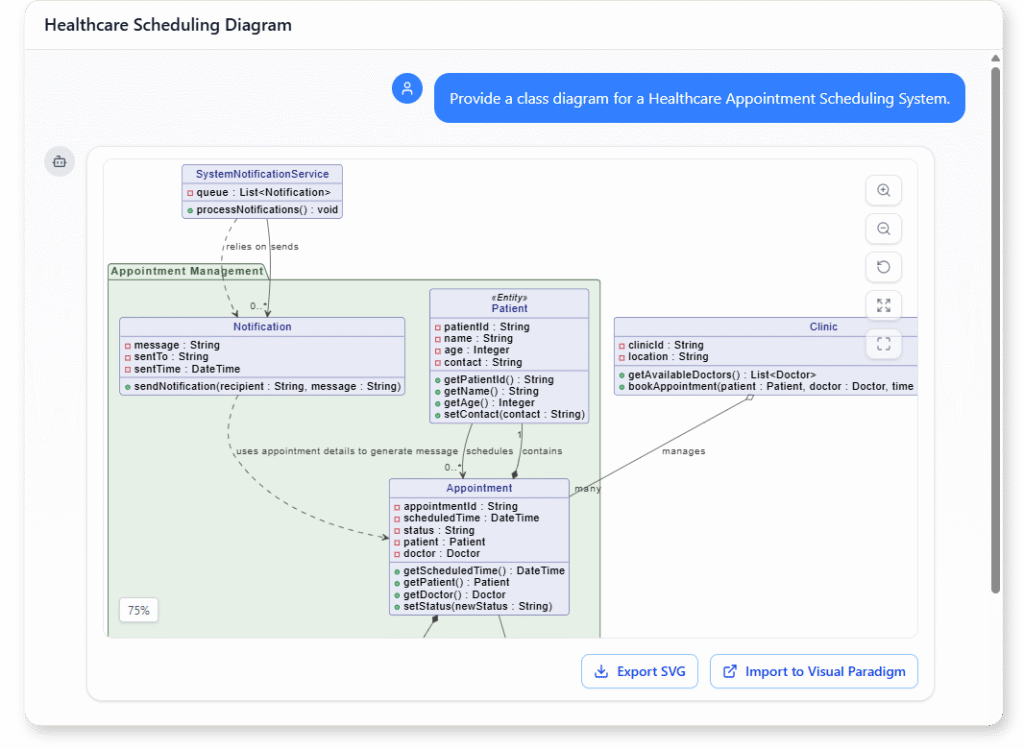
“Provide a class diagram for a Healthcare Appointment Scheduling System.”
What is a UML Class Diagram
A UML Class Diagram is a structural modeling tool that shows the main classes in a system along with their attributes, operations, and the relationships between them. It provides a clear overview of how data is organized and how different components connect, forming the foundation of object-oriented design.
Class diagrams are important because they help you define system structure before coding begins. They clarify responsibilities, highlight dependencies, and ensure the architecture is consistent and well-organized. Whether you are planning a new system or documenting an existing one, a class diagram builds a shared understanding across your team.
Key Concepts
Class Diagram
A class diagram is a type of UML diagram that models the structure of a system by showing its classes, their attributes, operations, and the relationships between them. It provides a blueprint of the system’s static design.
Parameter
Parameters are inputs to an operation. Each parameter defines:
Name: the variable name (e.g.,
quantity).Type: the data type (e.g.,
Integer).
Example: + addProduct(productName : String, quantity : Integer) : Boolean
Attribute
A class represents a blueprint for objects. It defines the attributes (data) and operations (behavior) that its objects will have. In diagrams, a class is shown as a rectangle divided into three parts: name, attributes, and operations.
Operation
An operation defines a behavior or function of a class. Each operation can specify:
Visibility: access level (same symbols as attributes).
Name: the identifier (e.g.,
calculateSalary).Return type: the type of result produced (e.g.,
Double).
Example: + calculateSalary() : Double
Realization
A realization shows that a class implements an interface. It is drawn as a dashed line with a hollow triangle pointing to the interface.
Aggregation
An aggregation is a weaker “whole–part” relationship. The part can exist independently of the whole. It is drawn as a hollow diamond at the whole side. Example: A Team class aggregating Player classes — players can exist without the team.
Class
A class represents a blueprint for objects. It defines the attributes (data) and operations (behavior) that its objects will have. In diagrams, a class is shown as a rectangle divided into three parts: name, attributes, and operations.
Package
A package groups related classes, interfaces, or other UML elements into a namespace. It helps organize large diagrams. Packages are drawn as a folder-like shape.
Interface
An interface defines a set of operations without implementation — essentially a contract that classes can realize. Classes that implement an interface must provide definitions for its operations. In UML, interfaces are shown as a rectangle with the label <<interface>>.
Generalization
A generalization shows an inheritance relationship, where a subclass inherits attributes and operations from a superclass. It is drawn as a solid line with a hollow triangle pointing to the parent class.
Composition
A composition is a strong “whole–part” relationship. The part (child) cannot exist without the whole (parent). It is drawn as a solid diamond at the whole side.
Example: A House class composed of Room classes — if the house is deleted, the rooms are too.
Dependency
A dependency shows that one class uses or depends on another, often temporarily (e.g., as a parameter or local variable). It is drawn as a dashed arrow pointing from the dependent to the provider class.
Ready to Revolutionize Your Workflow with AI?
Stop wrestling with tools. Embrace AI-powered visual modeling. Let our AI handle the visualization so you can focus on solving the bigger problems.