


Timing Diagram
A Timing Diagram visualizes how state changes, signal transitions, and conditions occur across object lifelines along a precise time axis.
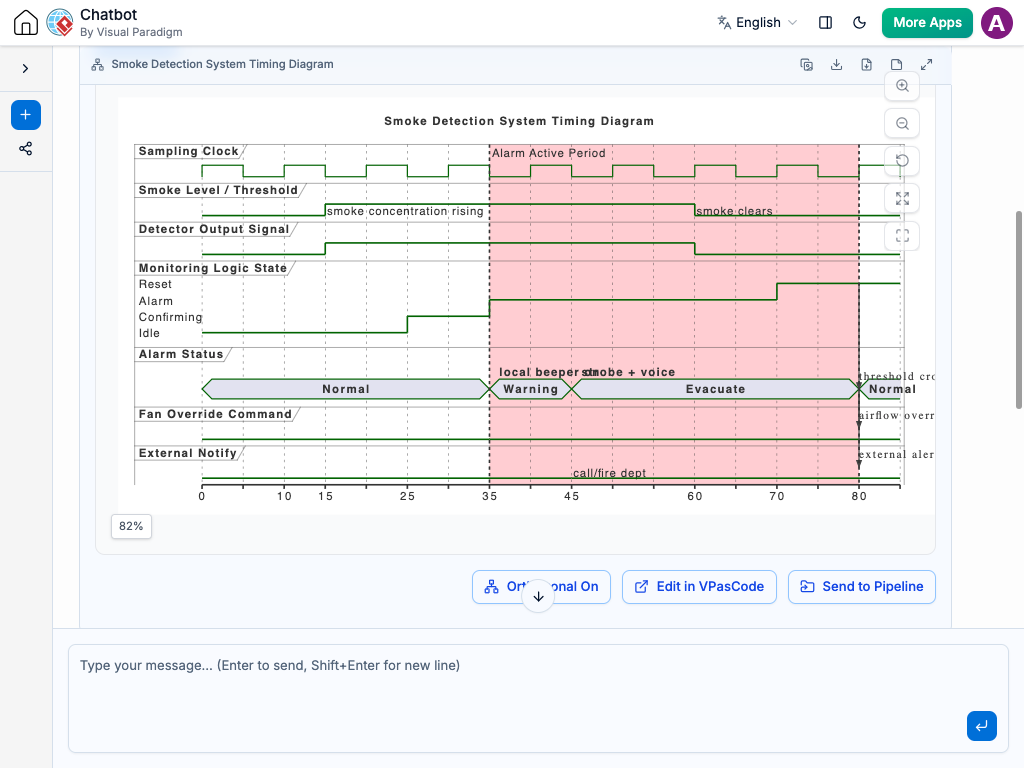
Instant Timing Diagram Creation
Mapping hardware signals, state transitions, and time-critical interaction flows no longer requires painstaking manual alignment on a canvas. Instead of manually drawing waveforms, setting up state tracks, and measuring time intervals, you can simply describe your system behavior to the AI Chatbot in plain language.
The system converts your logic into a clean, structured Timing Diagram. It automatically sets up object lifelines, tracks high/low signal states, and marks exact duration constraints. Whether you are modeling embedded hardware protocols or complex concurrent software systems, you get an accurate timing layout in seconds.
Refine Timing Constraints Through Conversation
Fine-tuning signal transitions and time boundaries is simple using natural language. You can adjust state durations, add lifelines, or modify clock conditions directly within the chat interface by entering requests like:
Add a new lifeline or signal: “Add a Sensor Input lifeline that toggles to Active 10ms after the power signal turns ON.”
Adjust time intervals: “Set a timing constraint requiring the Acknowledgment signal to respond within 50ms.”
Modify state transitions: “Change the motor controller state from Idle to Running when the start command is received.”
The diagram updates instantly, automatically realigning waveform tracks, transition markers, and time markers so your timing logic remains clear and precise.


Standard UML Waveform Notation: Automatically uses correct notation for value lifelines, state tracks, and signal transitions.
Precision Constraint Alignment: Easily defines and displays exact duration intervals (e.g., $t < 20\text{ms}$) between interaction events.
Multi-Lifeline Synchronization: Synchronizes state changes across multiple concurrent components without overlapping lines.
Hardware & System Validation: Helps engineers detect race conditions, timing violations, and missing pulse signals early in design.
Examples of Generating Timing Diagrams
Traffic Light Controller Sequence
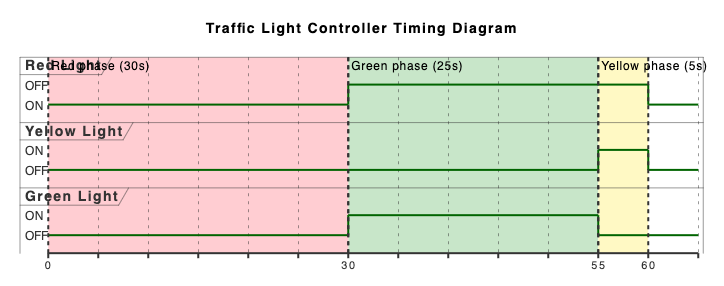
“Generate a timing diagram for a traffic light controller showing state changes between Red, Green, and Yellow with specific time durations.”
SPI Communication Protocol
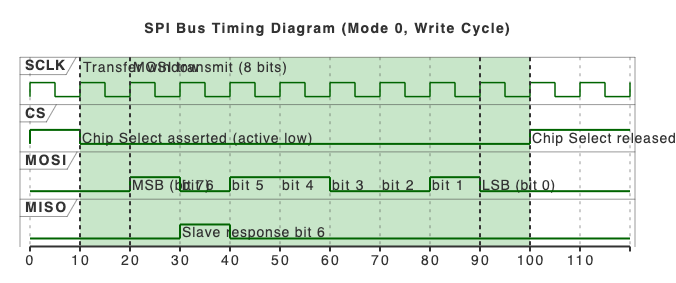
“Create a timing diagram for an SPI bus protocol showing SCLK, MOSI, MISO, and CS signal transitions during a data write cycle.”
Memory Read/Write Timing
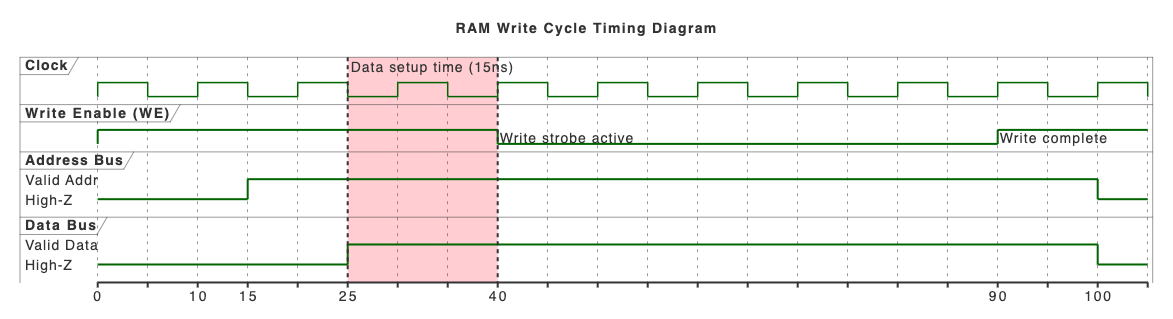
“Create a timing diagram showing a RAM write cycle with Address Bus, Data Bus, and Write Enable (WE) signals with a 15ns setup constraint.”
What is a Timing Diagram?
A Timing Diagram is a specialized UML interaction diagram that illustrates how conditions or states of one or more objects change over time. Unlike sequence diagrams that emphasize message order, timing diagrams focus explicitly on the continuous passage of time, signal durations, and state transitions along a horizontal timeline.
Timing Diagrams are widely used by embedded systems engineers, hardware developers, and real-time software architects to document communication protocols, analyze bus timing, and design time-sensitive electronics.
Key Concepts
State Lifeline
A horizontal track representing an individual object or signal, showing its specific states (e.g., Idle, Processing, Error) across time.
Value Lifeline
A waveform-style track used for digital or analog signals to show changes in value (e.g., High/Low, 0/1, or continuous levels).
State Transition
Vertical or sloped lines connecting different states or values to indicate a change triggered by an event.
Timing Constraint
Visual markers indicating maximum, minimum, or exact duration requirements between state changes (e.g., $\{d < 100\text{ms}\}$).
Time Axis
The horizontal dimension representing elapsed time, divided into discrete ticks or continuous intervals.
Ready to Model System Timing & Signals with AI?
Stop spending hours manually aligning waveforms and timing markers. Turn complex hardware signals and state transitions into clear UML timing diagrams instantly through simple conversation.