Read this post in:

Flowchart Diagram

A Flowchart maps out the step-by-step sequence of a workflow, showing the actions, decisions, and logic paths from start to finish.

Instant Flowchart Creation

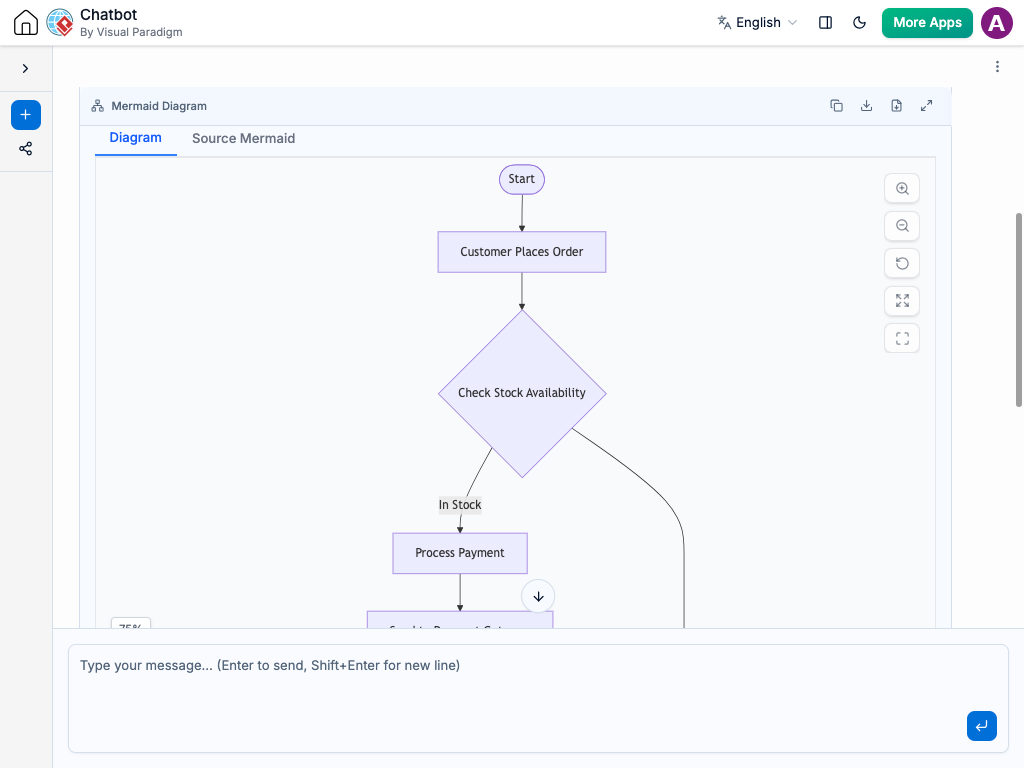
With the AI chatbot, mapping out your business processes becomes much easier. Instead of manually drawing boxes, routing directional lines, and aligning diamond decision points, you can simply describe your workflow in plain language.

The chatbot converts your explanation into a clean Flowchart that highlights how tasks progress, where choices are made, and what the final outcomes are. Whether you are documenting a customer support protocol or mapping a complex software backend process, the AI quickly generates a clear visual map of your sequence.

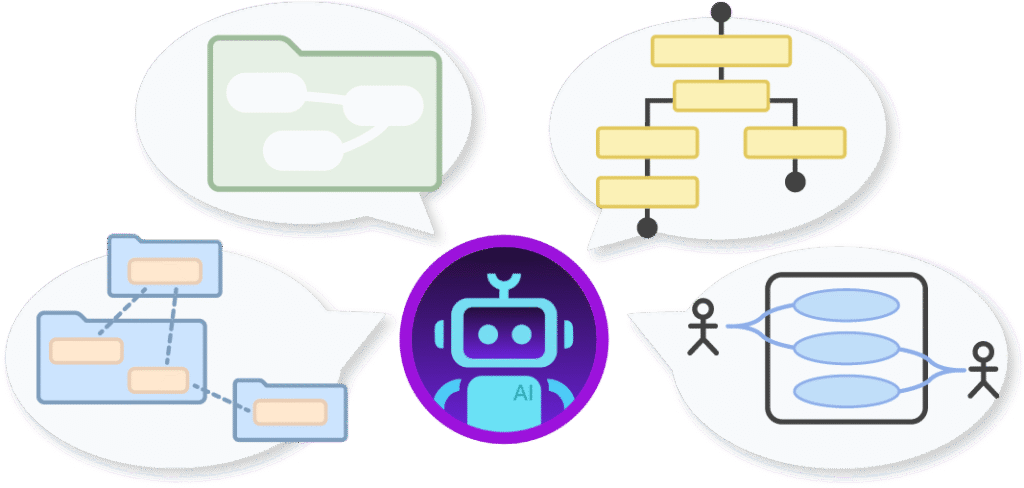
The AI Chatbot can generate different diagrams according to your need in the chat.

Refine the Logic Through Conversation

Workflows are rarely perfect on the first try, so the AI lets you “stress-test” your process logic through chat. You can ask the AI to:

  • Add a condition: “What happens if the user forgets their password?”

  • Insert a step: “Add a notification check right after the manager approves the request.”

  • Fix loops: “Make sure the process goes back to the review stage if the document is rejected.”

The diagram updates instantly, automatically rearranging the connecting lines and shapes so your visual layout stays clean and readable. This conversational approach helps you uncover dead ends, shorten complex loops, and ensure your workflow handles every scenario gracefully.

Benefits of Creating Flowcharts with the AI Chatbot
tick-icon-3.png

Standard Shape Library: Automatically uses correct ISO-standard shapes for terminals, processes, decisions, and inputs.

tick-icon-3.png

Dead-End Detection: Validates your logic to ensure every branch eventually leads to an endpoint without getting stuck.

tick-icon-3.png

Auto-Routing Connections: Instantly handles line routing, keeping arrows straight and eliminating overlapping lines.

tick-icon-3.png

Clean Condition Splits: Cleanly separates “Yes” and “No” paths from decision diamonds for effortless readability.

tick-icon-3.png

Process Standardization: Converts scattered operational habits into structured, easy-to-follow company procedures.

tick-icon-3.png

Bottleneck Discovery: Visually highlights complex, multi-step sub-routines that might be slowing down your operations.

Examples of Generating Flowcharts

Use simple text prompts to generate this diagram in seconds. Here are a few examples to get you started:
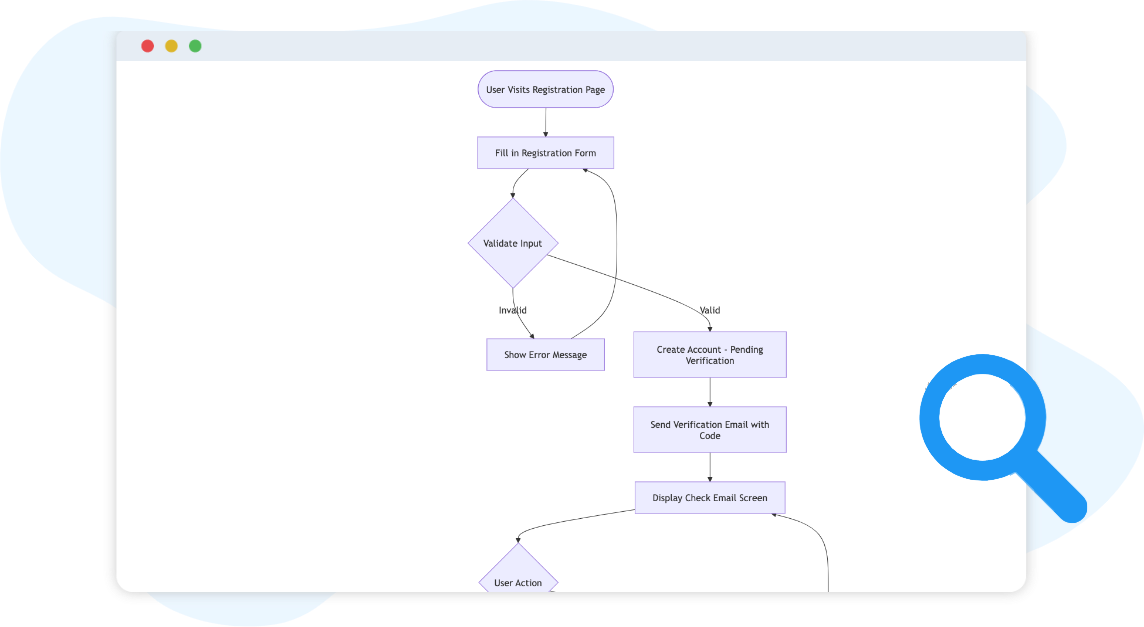
User Sign-Up Process

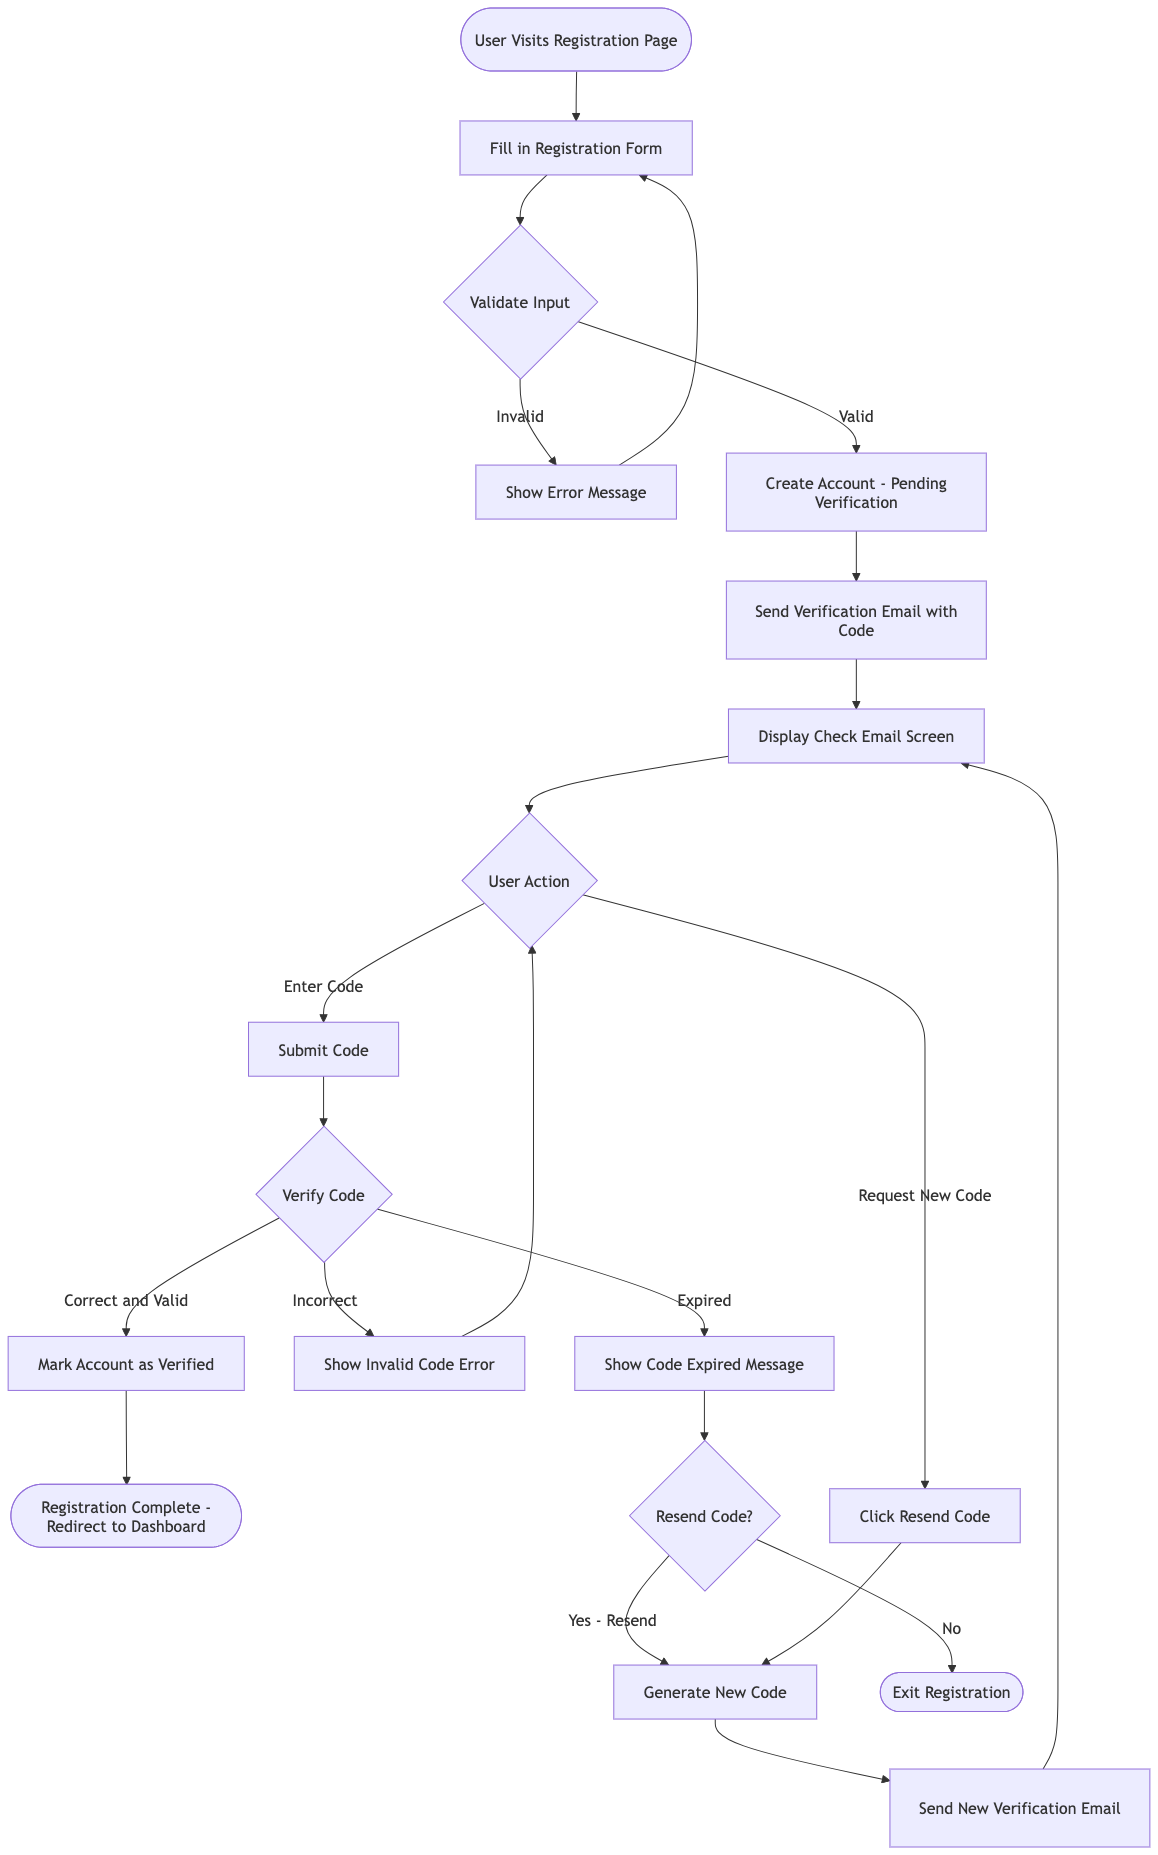
“Generate a flowchart for a user registration workflow including email verification and an option to resend the code if it expires.”

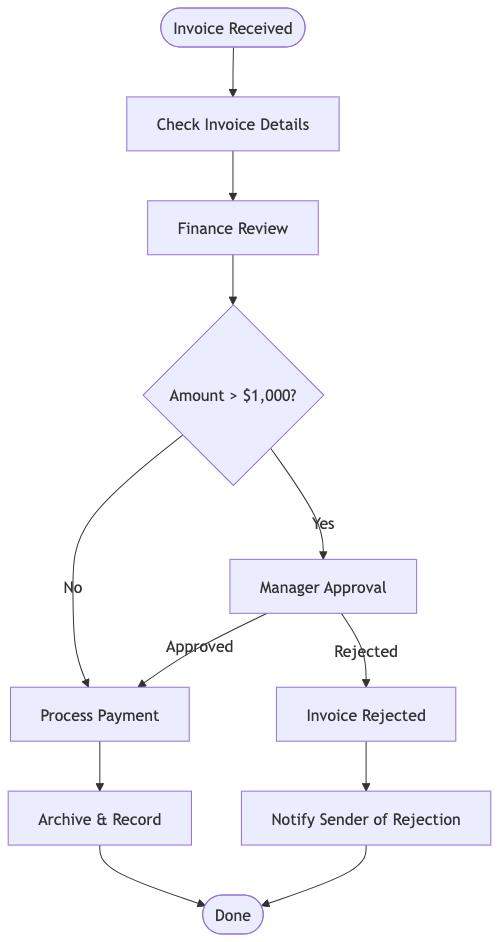
Invoice Approval Workflow

“Create a flowchart showing how an invoice gets received, reviewed by finance, approved by a manager if it is over $1,000, and paid.”

Product Launch Decision Tree

“Generate a flowchart for a product development launch checklist showing market research, goal alignment, and budget approval steps.”

What Is a Flowchart?

A Flowchart is a sequential visual tool used to show the step-by-step progress of a workflow or process. By breaking down an operational concept into distinct shapes and arrows, it strips away language confusion and reveals the exact mechanics of how a system behaves from start to finish.

The 4 Simple Elements of Your Process Map:

  • Terminators (The Boundaries): These rounded rectangles mark the official Start or End of the process.

  • Processes (The Actions): These rectangles represent a specific task, action, or operation being performed.

    • Examples: Send Confirmation Email, Log to Spreadsheet.

  • Decisions (The Choices): These diamonds display a question or condition that splits the process into separate paths, typically labeled Yes and No.

    • Examples: Is Payment Approved? Is User Logged In?

  • Connectors (The Directions): The arrows that direct the reader from one shape to the next, proving exactly how the workflow flows.

Key Concepts

Sequence
The fundamental rule that actions must occur in a specific linear order. It guarantees that step B cannot occur until step A is completed successfully.
The moment a process splits based on a condition. It allows a single diagram to map out multiple alternate scenarios, depending on how a question is answered.
A repeating series of steps that continues until a specific condition is met (such as repeating a login prompt until the password entered is correct).
Inputs & Outputs
Parallelogram shapes used to show when raw data or physical materials are entered into the system, or when a final report or product is delivered out.
A complex, multi-step process that is encapsulated in a single double-walled rectangle. This allows you to reference an external system process without cluttering your current diagram.

Ready to Revolutionize Your Workflow with AI?

Stop wrestling with design tools. Embrace AI-powered visual modeling. Let our AI handle the visualization so you can focus on solving the bigger process problems.
Scroll to Top