


Git Graph Diagram
A Git Graph Diagram visualizes Git branching strategies, commit histories, merge flows, and release tags to help teams manage code repositories effectively.
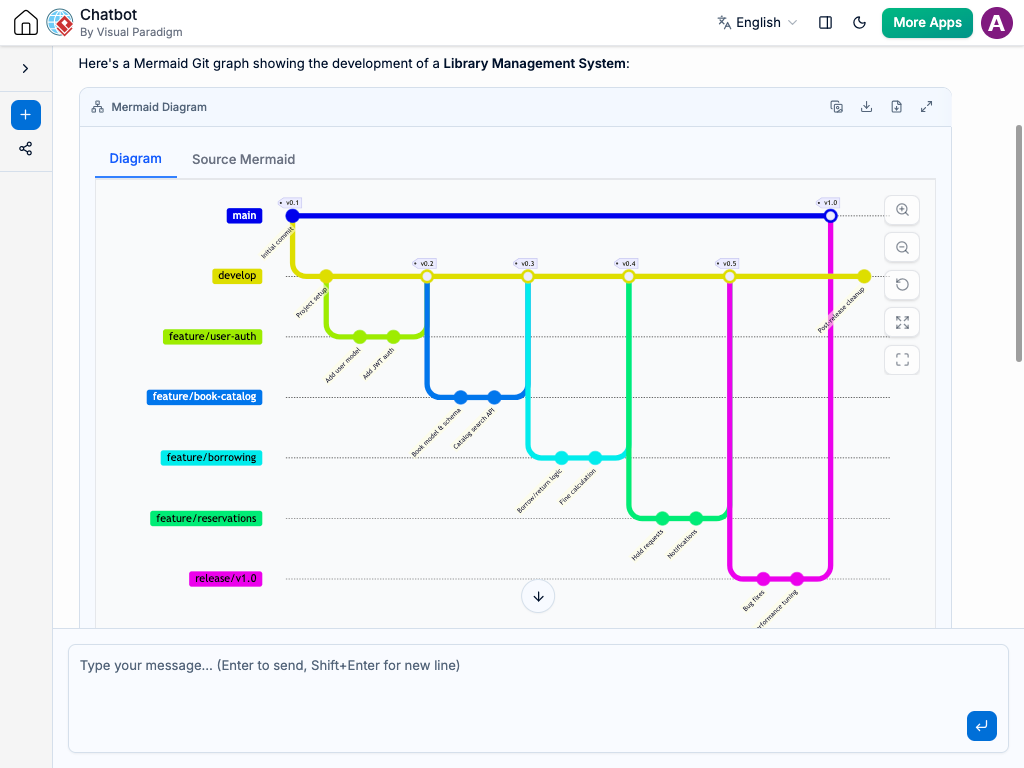
Instant Git Graph Diagram Creation
Visualizing complex branching models no longer requires manual drawing or tedious syntax configuration. Instead of plotting commit nodes, branch lines, and merge points by hand, you can simply describe your version control workflow to the AI Chatbot in plain language.
The system translates your description into a clean, structured Git Graph Diagram. It automatically sets up branch timelines, tags, and merge arrows to illustrate how code moves from development to production. Whether you are mapping a Feature Branch workflow or setting up Gitflow, you get an accurate visual overview in seconds.
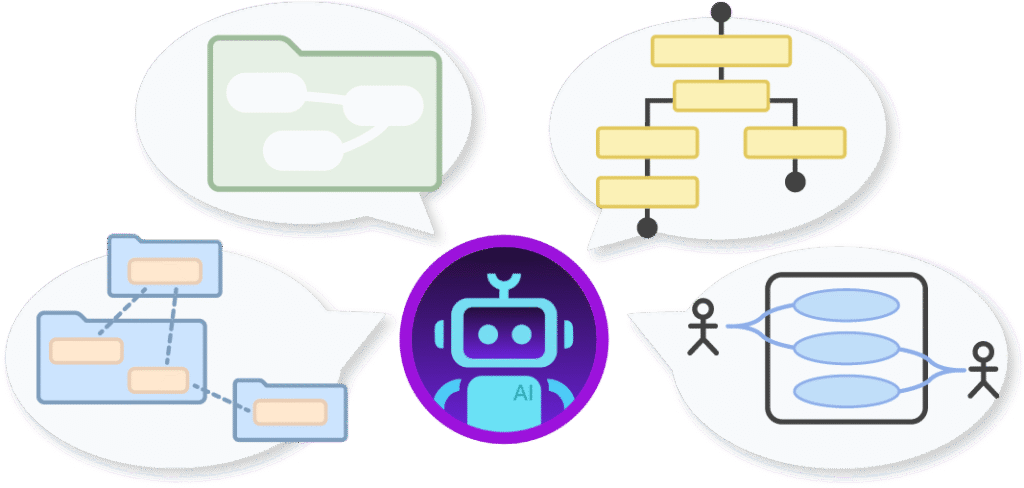
Refine Branching Logic Through Conversation
Version control strategies evolve as project requirements change, and you can easily update your Git graph directly inside the chat interface. Simply type requests such as:
Add a new branch: “Create a hotfix branch off main and merge it back into both main and develop.”
Insert commits and tags: “Add two commit nodes on the release branch and tag the final one as v1.2.0.”
Adjust merge pathways: “Show a cherry-pick commit from the feature branch directly onto release.”
The diagram updates instantly, automatically adjusting commit nodes, branch colors, and connecting lines so your workflow remains clean and easy to read.

Standard Version Control Symbols: Automatically renders commits, branches, merges, and tags using standardized Git graph conventions.
Auto-Aligned Timelines: Places commit points sequentially and organizes branches parallelly without manual node positioning.
Workflow Validation: Helps your team spot improper branch dependencies, missing merge steps, or confusing release pathways before coding starts.
Smart Line Routing: Keeps branch lines crisp and color-coded, preventing messy overlaps as repository history grows.
Examples of Generating
Git Graph Diagram
Feature Branch Workflow
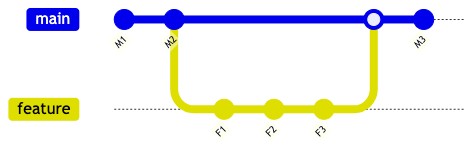
“Generate a Git Graph Diagram showing a main branch with a feature branch branching off, receiving three commits, and merging back into main.”
Gitflow Release Strategy
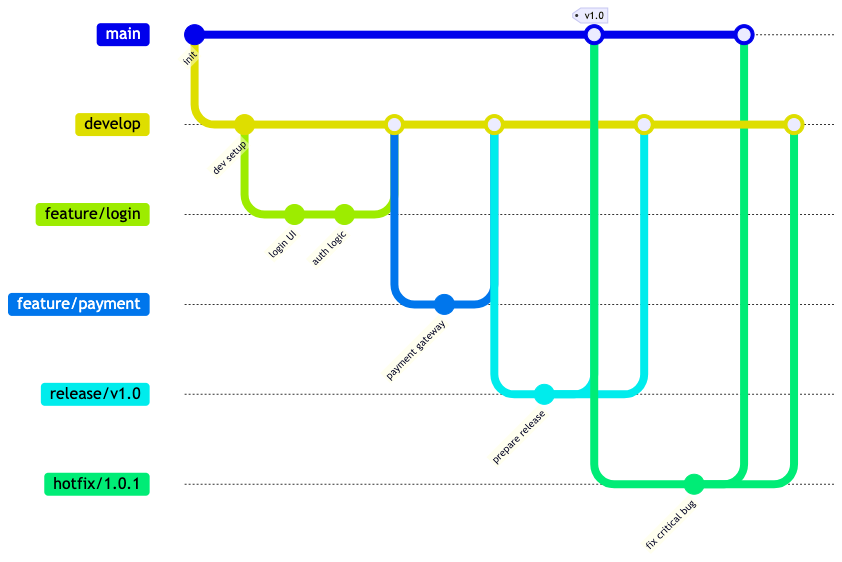
“Create a Git Graph Diagram demonstrating Gitflow with main, develop, feature, and release branches, including a v1.0 tag on main.”
Hotfix Branch Execution
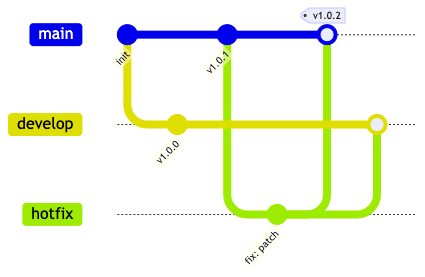
“Create a Git graph showing an emergency hotfix branch created from main v1.0.1, patched, and merged back into both main and develop.”
What is a Git Graph Diagram?
A Git Graph Diagram (Gitgraph) is a visual representation of a Git repository’s history and branching strategy. It illustrates individual commit nodes, parallel branch executions (such as main, develop, or feature), merge events, and release tags along a timeline.
Git Graph Diagrams are essential for software engineers, DevOps specialists, and technical leads to document repository workflows, explain branching standards, and onboard team members to project release cycles.
Key Concepts
Commits
Containers and lanes that clearly separate responsibilities by organizational bouIndividual nodes representing specific checkpoints or code changes along a branch timeline.ndaries, departments, or specific roles (e.g., Customer, Finance, Operations).
Branches
Parallel timeline paths (e.g., main, feature/login, bugfix) representing independent lines of development.
Merge Points
Connecting points where changes from one branch are integrated back into another branch.
Tags
Named markers attached to specific commits to identify key milestones, such as release versions (e.g., v1.0.0).
HEAD / Current Pointer
Indicators showing the active commit or tip of a specific branch in the development sequence.
Ready to Visualize Your Git Workflows with AI?
Stop spending hours manually drawing branch lines and commit nodes. Turn complex version control strategies into clear Git graph diagrams instantly through simple conversation.