Ishikawa Diagram
(Fishbone Diagram)
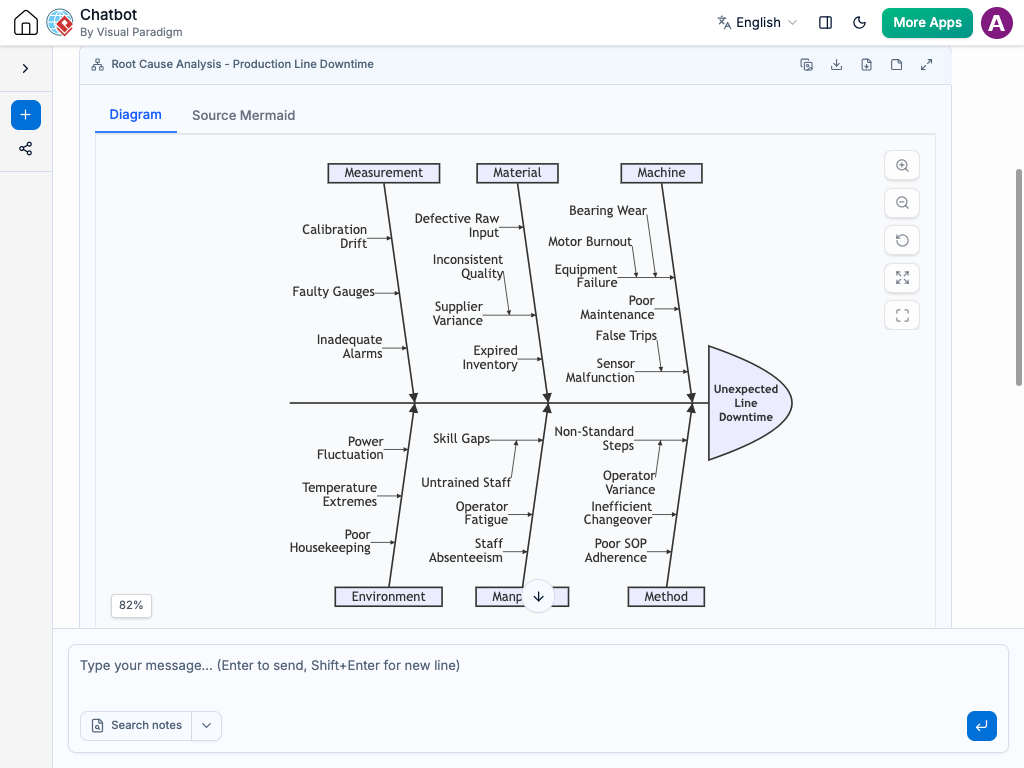
The AI Chatbot helps you build Ishikawa (Fishbone) Diagrams by analyzing core problems, grouping contributing factors into primary categories, and surfacing root causes to speed up quality management and troubleshooting.
Instant Fishbone Diagram Creation
Pinpointing the root causes of system failures or process bottlenecks shouldn’t require manual shape alignment and tedious connector drawing. Instead of manually drawing fishbone spines, sub-branches, and text blocks by hand, simply describe your problem and suspected causes to the AI Chatbot in plain language.
Our AI Chatbot translates your description into a structured Ishikawa Diagram. It automatically sets up the head (problem statement), primary categories (such as Methods, Machines, People, or Materials), and secondary sub-causes. Whether you are troubleshooting software latency, production delays, or customer support issues, you get a clear visual breakdown in seconds.
Refine Root Cause Analysis Through Conversation
As your investigation uncovers new details, updating your diagram is as easy as sending a quick chat message. Adjust your cause-and-effect structure effortlessly with prompts like:
Add cause categories: “Add a new branch for Environment factors like room temperature and humidity.”
Detail secondary causes: “Under the Software category, add sub-causes for database timeouts and memory leaks.”
Update the problem statement: “Change the main problem to ‘Customer Checkout Delays Exceed 5 Seconds’.”
The AI updates your diagram on the fly—automatically balancing branches, connecting sub-causes, and keeping the spine layout neat. This conversational approach keeps your team focused on problem-solving rather than diagram formatting.
Benefits of Creating Ishikawa Diagrams with the AI Chatbot
Standard Problem-Solving Frameworks: Effortlessly apply standard 6Ms (Manufacturing), 4Ps (Service), or 8Ps frameworks.
Automated Layout & Symmetry: Keeps primary branches and secondary sub-causes organized cleanly along the central spine automatically.
Faster Root Cause Discovery: Translates brainstorming sessions into structured cause-and-effect maps instantly.
Examples of Generating
Ishikawa Diagram
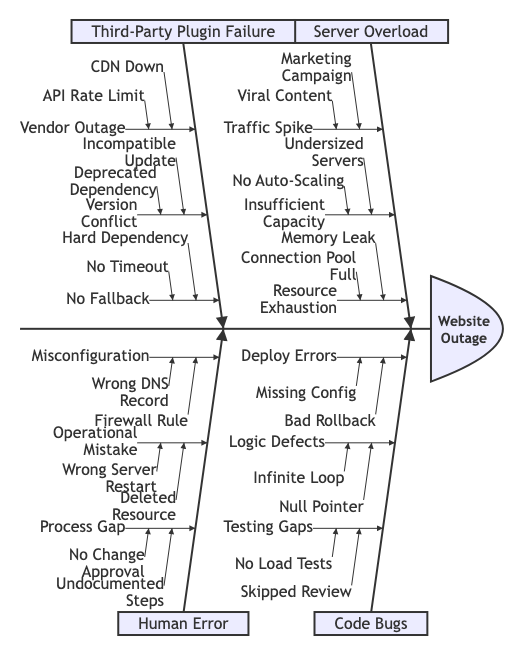
“Create an Ishikawa diagram for a website outage caused by server overload, code bugs, third-party plugin failure, and human error.”
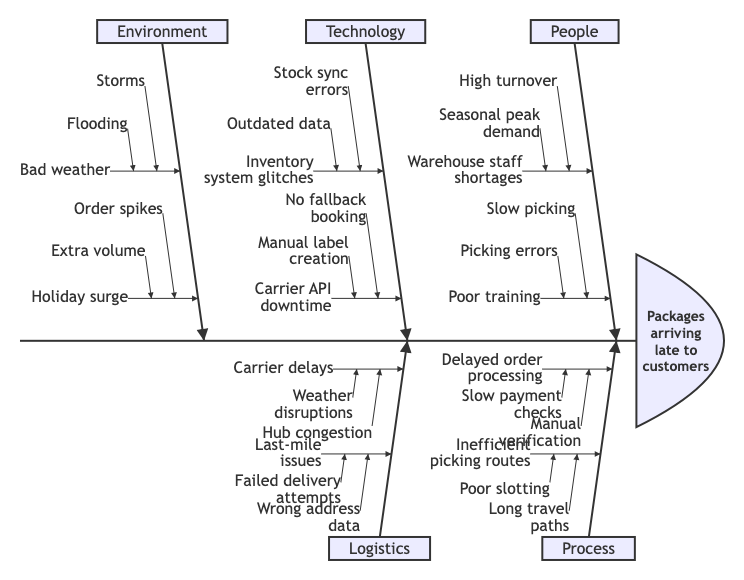
“Draw a fishbone diagram analyzing why online store packages are arriving late to customers.”
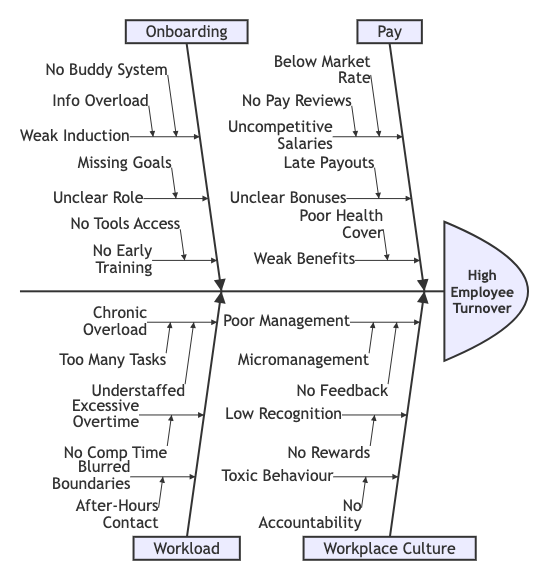
“Generate an Ishikawa diagram for high employee turnover looking at pay, workplace culture, onboarding, and workload.”
What is an Ishikawa Diagram?
An Ishikawa Diagram, also known as a Fishbone Diagram or Cause-and-Effect Diagram, is a visual tool used to identify, organize, and analyze the potential causes of a specific problem or outcome. The “head” represents the defect or problem, while the “spine” and “bones” categorize contributing factors.
Key Concepts
Problem Statement (The Head)
The specific issue, defect, or target outcome being analyzed, positioned at the far right of the central spine.
Primary Categories (Major Bones)
Main branches extending off the spine that group causes into logical areas (e.g., Equipment, Process, People, Environment).
Contributing Causes (Sub-Bones)
Specific factors listed along each category branch that explain why or how that area contributes to the main problem.
Ready to Find Root Causes Faster with
AI Ishikawa Diagrams?
Map out problem causes, secondary factors, and category branches in seconds using simple AI prompts.