JSON Diagram
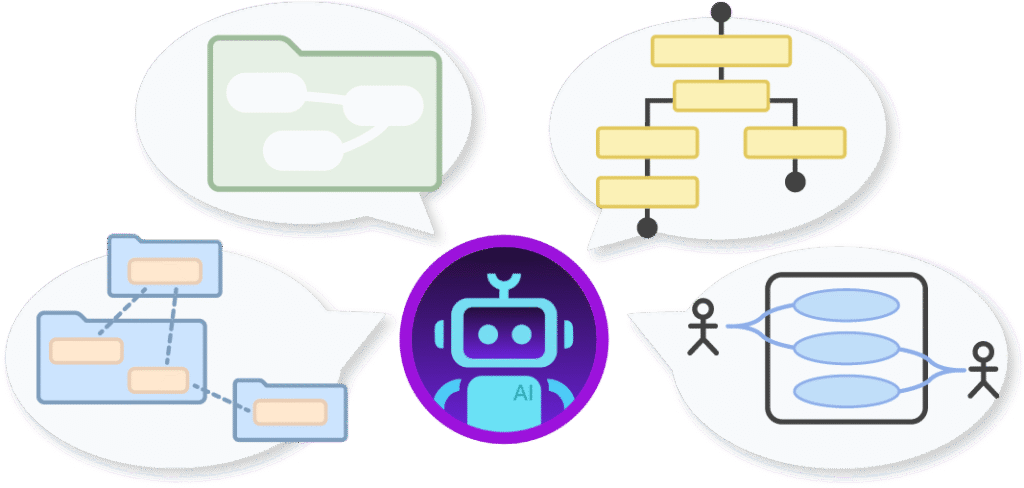
A JSON Diagram transforms complex nested JSON objects, arrays, and API payloads into easy-to-read visual structures for clear data modeling and analysis.
Instant JSON Diagram Creation
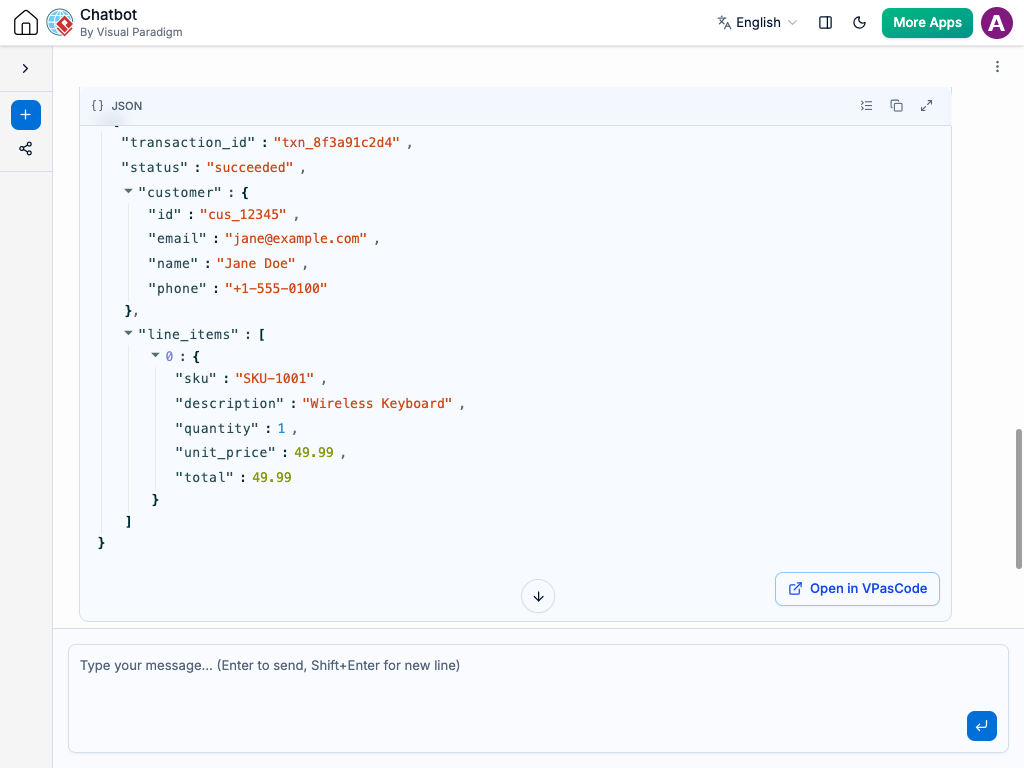
Reading through hundreds of lines of nested JSON code to understand data relationships can be time-consuming and prone to errors. Instead of manually inspecting curly braces and indentation, you can paste your raw JSON string or describe your data structure to the AI Chatbot.
The system instantly parses the data and converts it into an intuitive, visual JSON Diagram. It automatically organizes key-value pairs, expands object hierarchies, and maps out arrays into structured visual nodes. Whether you are reviewing API response structures or designing data schemas, you get an easy-to-read visual breakdown in seconds.
Refine JSON Structures Through Conversation
Updating data models and adjusting schemas is seamless using natural language. You can fine-tune your visual JSON structure directly within the chat interface by entering requests like:
Add new attributes: “Add a new ‘shipping_address’ object containing street, city, and zip code to the customer payload.”
Modify data types: “Change the ‘tags’ property from a string to an array of strings.”
Simplify or expand views: “Hide the detail array inside ‘metadata’ to focus on top-level keys.”
The diagram updates instantly, automatically reorganizing nodes and maintaining clean visual hierarchy so your data structures remain easy to understand.
Automatic Schema Parsing: Effortlessly converts complex, deeply nested JSON strings into structured visual trees without manual layout work.
Clear Data Hierarchy: Clearly distinguishes between objects, arrays, primitives, and null values through organized visual grouping.
Faster API Integration: Helps developers and analysts quickly comprehend third-party API payloads and data models at a glance.
Error-Free Validation: Easily spot missing keys, mismatched data types, or improper nesting without digging through raw code.
Examples of Generating
JSON Diagram
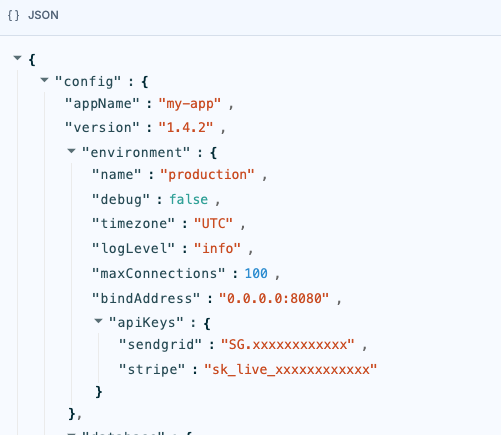
App Configuration File
“Generate a JSON diagram showing an app config structure with environment settings, database connection strings, and feature toggle flags.”
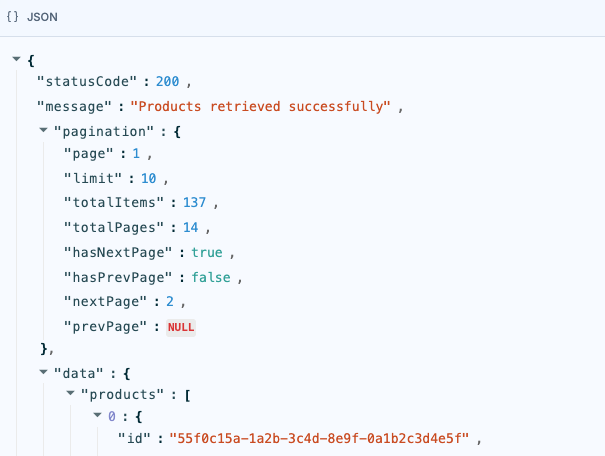
REST API Response Structure
“Generate a JSON diagram for a standard REST API response containing status code, message, pagination metadata, and an array of product objects.”
E-Commerce User Profile Payload
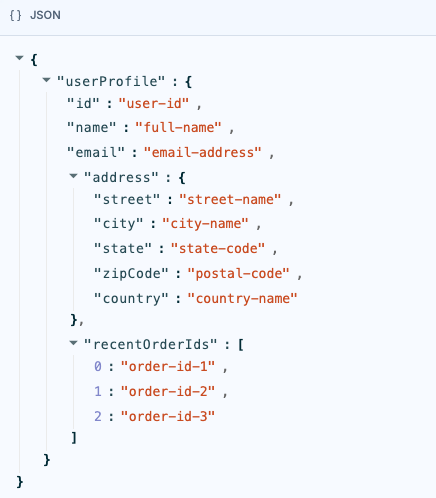
“Generate a JSON diagram representing a user profile object with fields for ID, name, email, an address sub-object, and an array of recent order IDs.”
What is a JSON Diagram?
A JSON Diagram is a graphical representation of JavaScript Object Notation (JSON) data. It maps out structured data by converting abstract code syntax—such as objects, arrays, key-value pairs, and data types—into a clear, tree-like visual map.
JSON Diagrams are widely used by software developers, API architects, data analysts, and system integrators to document API schemas, inspect response payloads, and design clean data exchange formats across backend and frontend systems.
Key Concepts
Objects
Key-value containers enclosed in curly braces {} that form structural nodes in the diagram tree.
Arrays
Ordered lists of values or objects enclosed in square brackets [], represented as sequential list branches.
Keys / Properties
Named identifiers that define individual data fields within an object.
Primitive Values
Fundamental data types including strings, numbers, booleans, and null values assigned to specific keys.
Nested Structures
Objects or arrays embedded inside other objects, forming multi-level visual hierarchies.
Ready to Visualize Your JSON Data with AI?
Stop squinting at raw JSON strings and endless curly braces. Transform complex data structures and API payloads into crystal-clear visual diagrams instantly through simple conversation.